
PROJECT SUMMARY
Improving the UX of Toronto's data during the pandemic
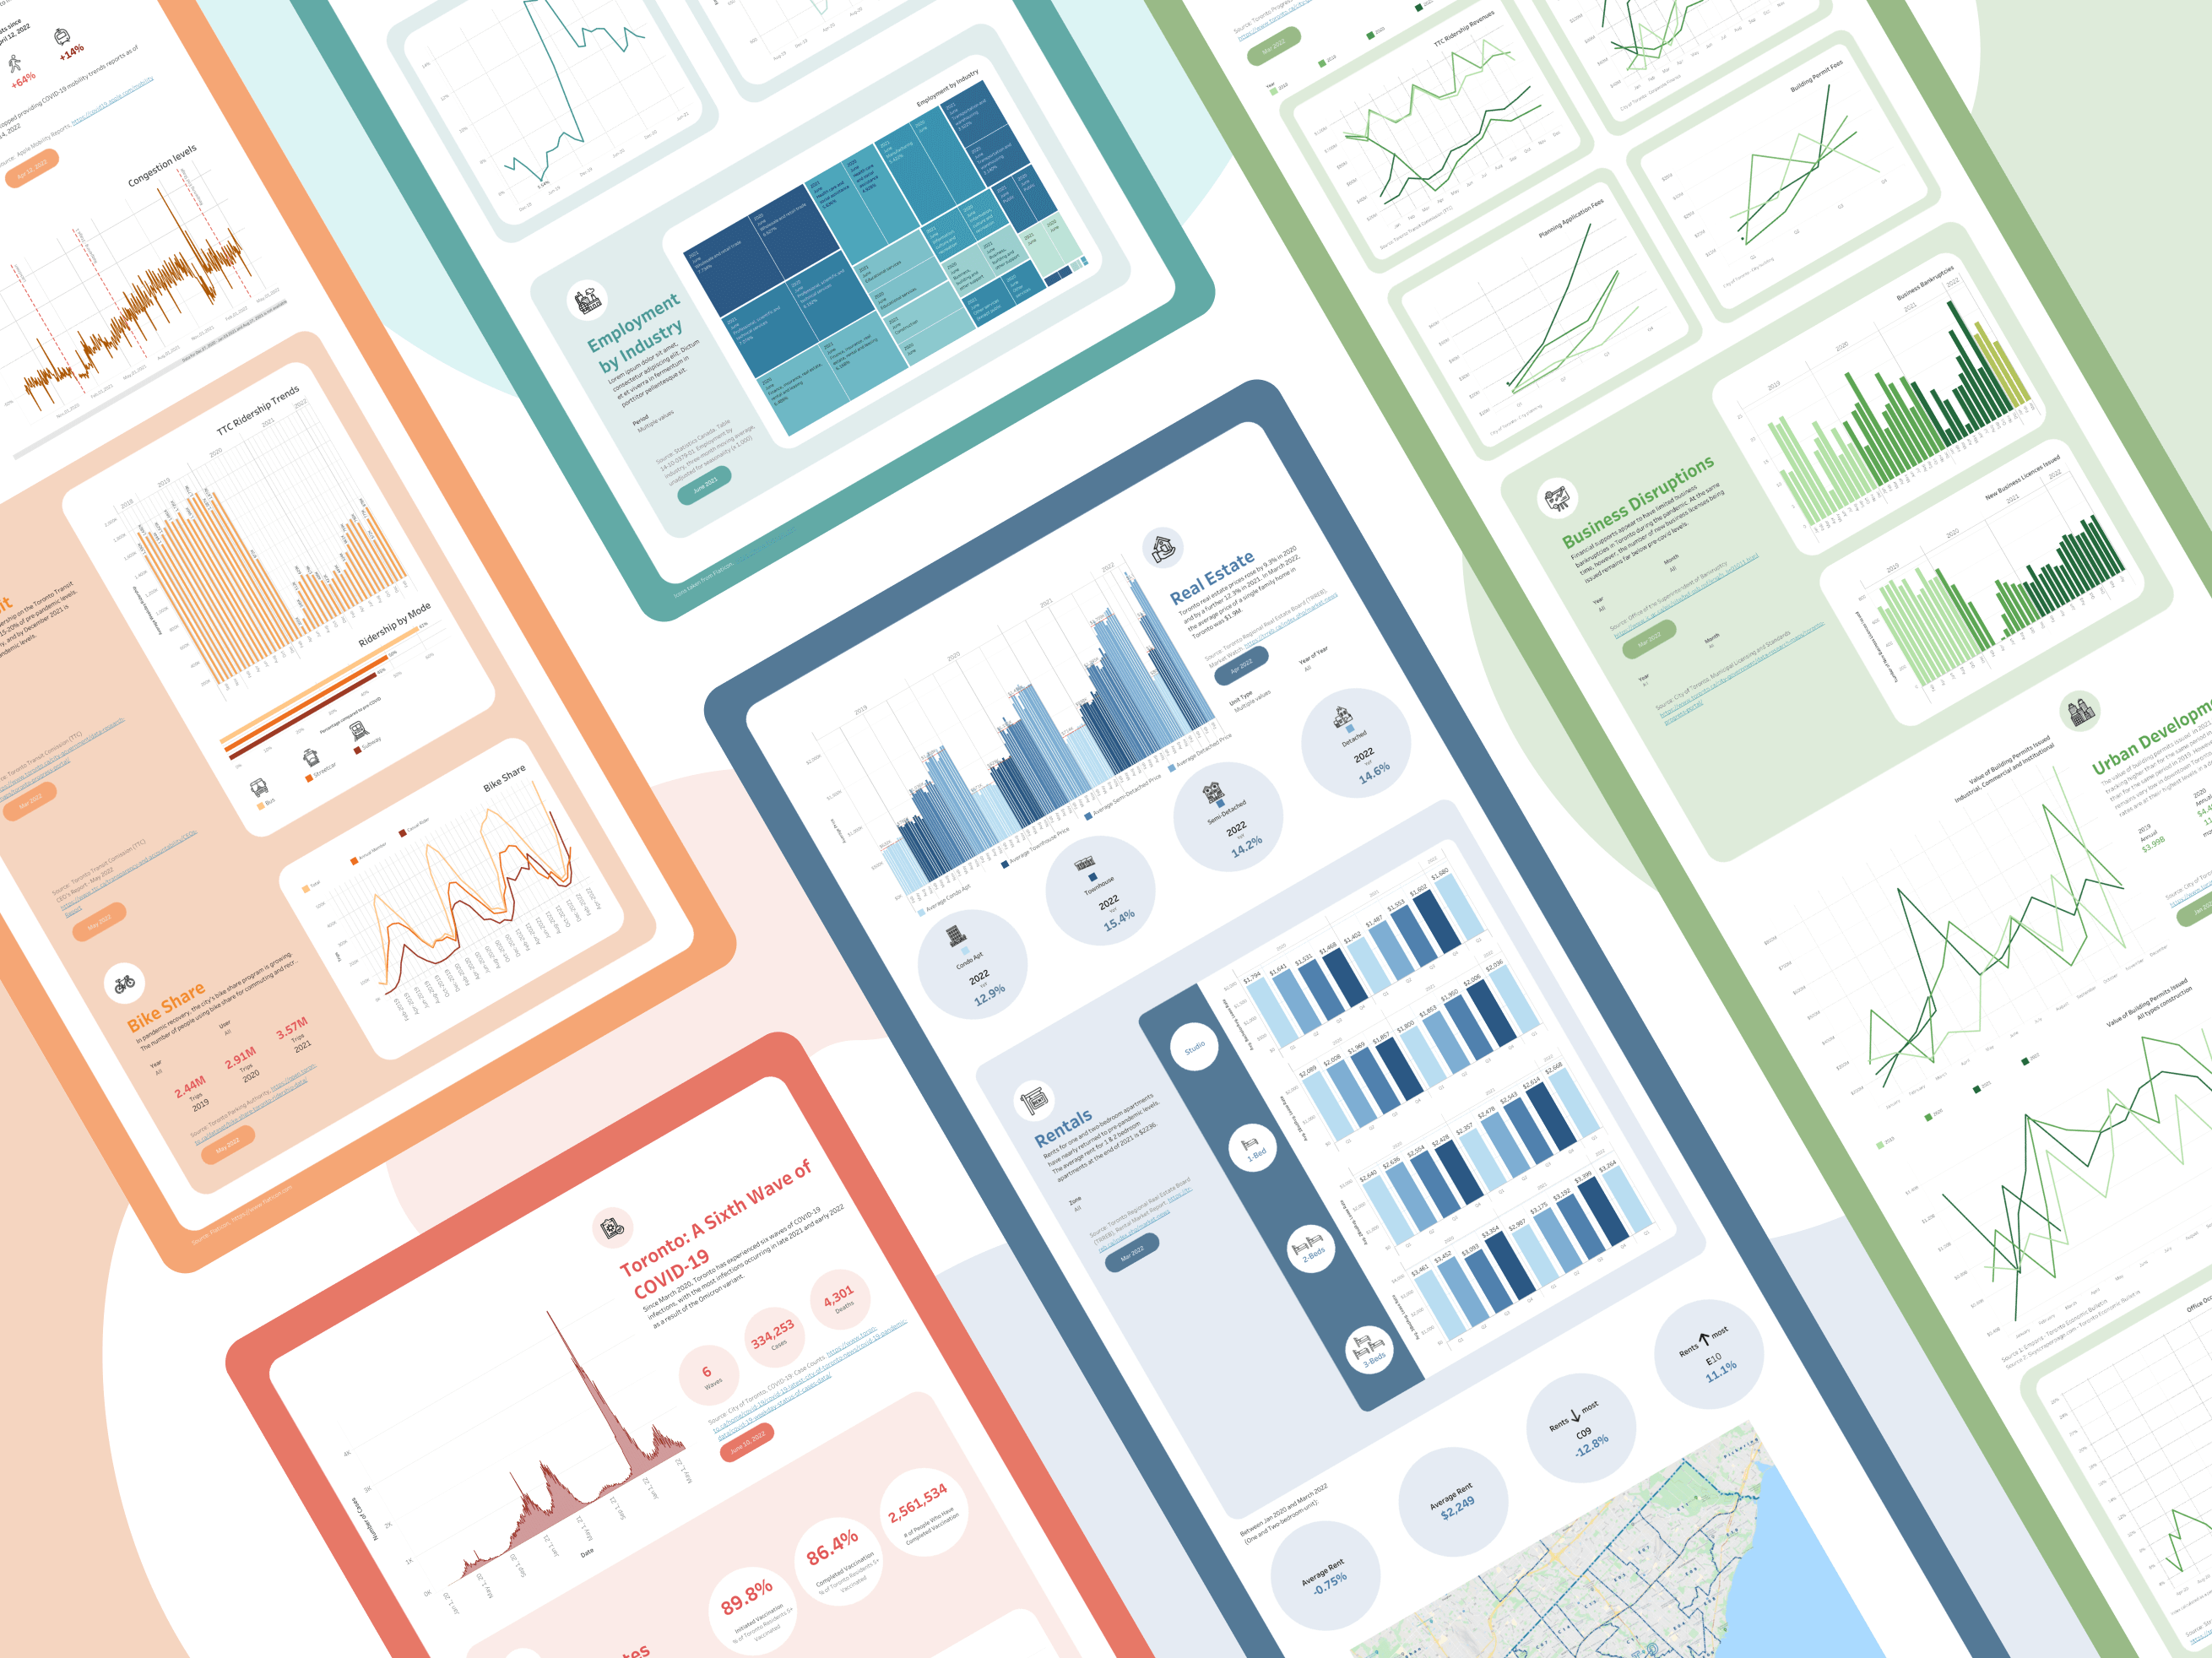
As the only designer, I played a crucial role in generating traffic of 50,000+ views by creating web-based dashboards that track the changes in Toronto during COVID-19. My team and I achieved this by carefully collecting and compiling data from reliable sources, simplifying it for public understanding, and creating impactful data visualizations.
↳ Featured in Spacing, The Star, iHeart Radio, and The Conversation
PROJECT
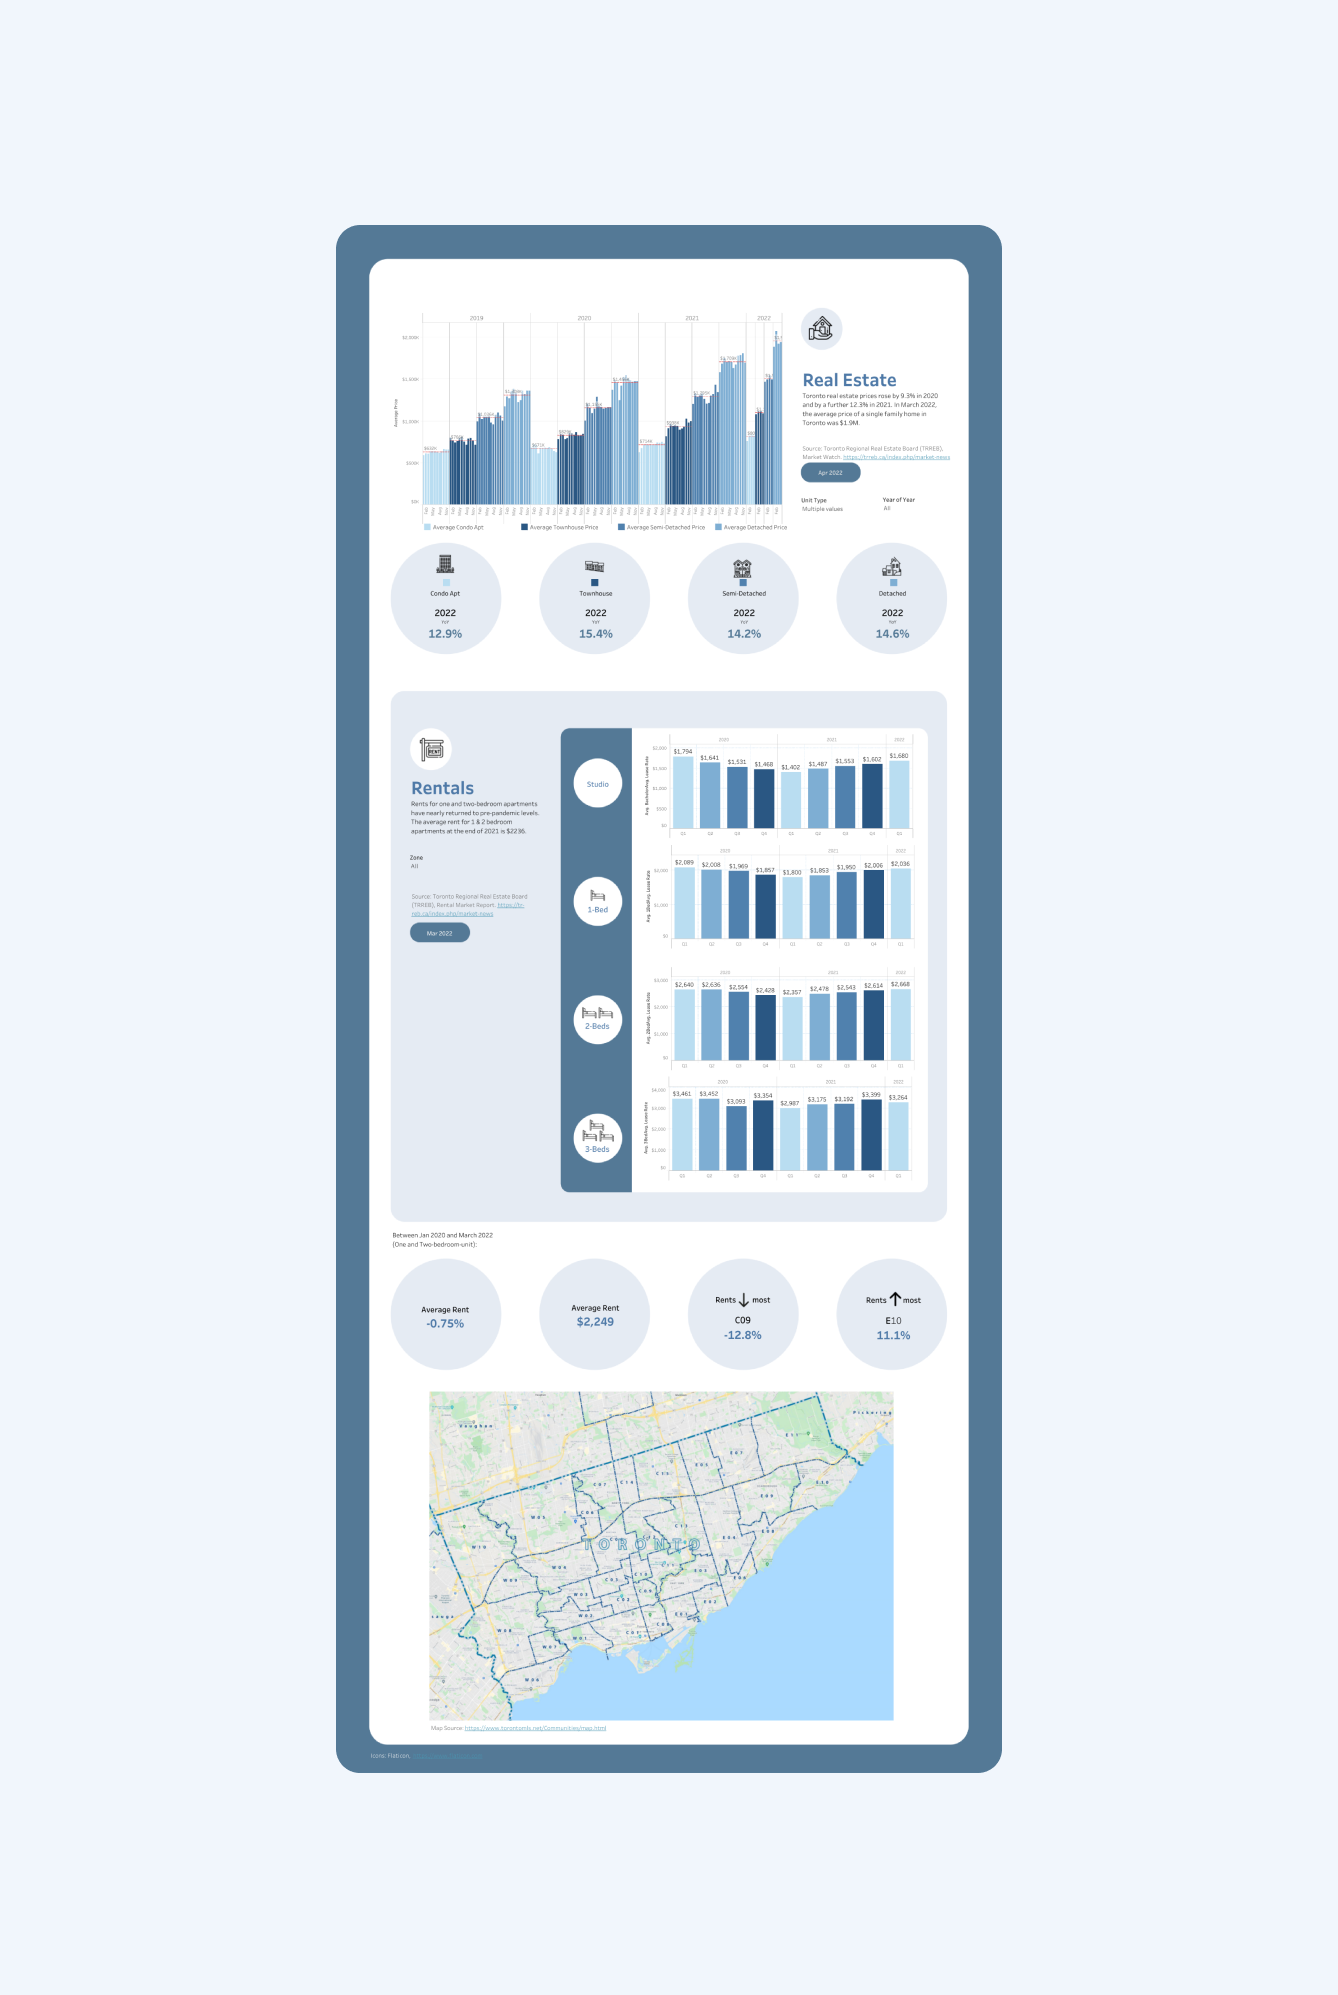
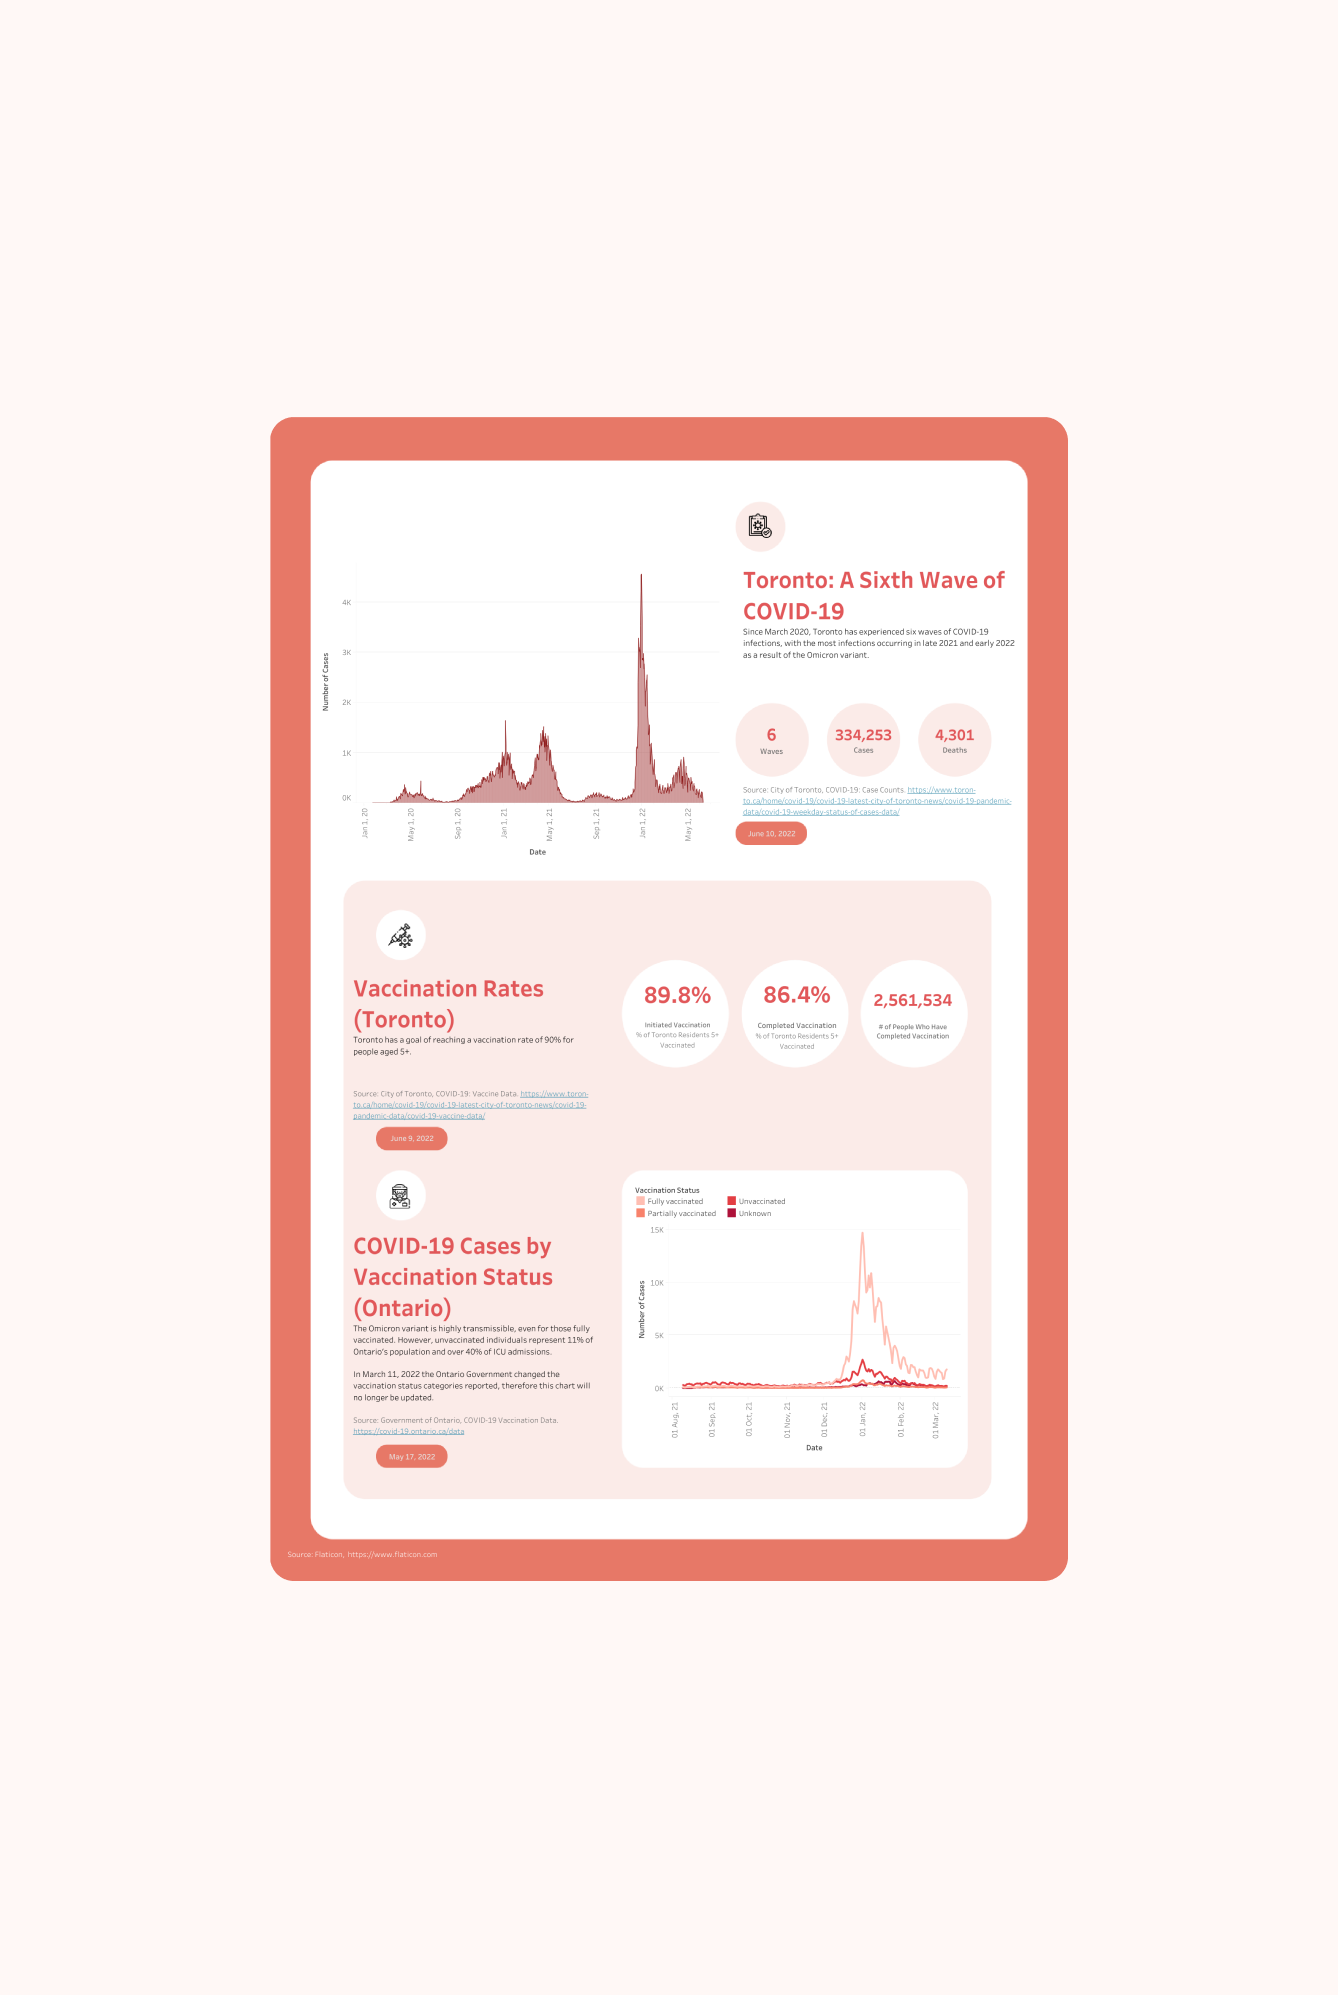
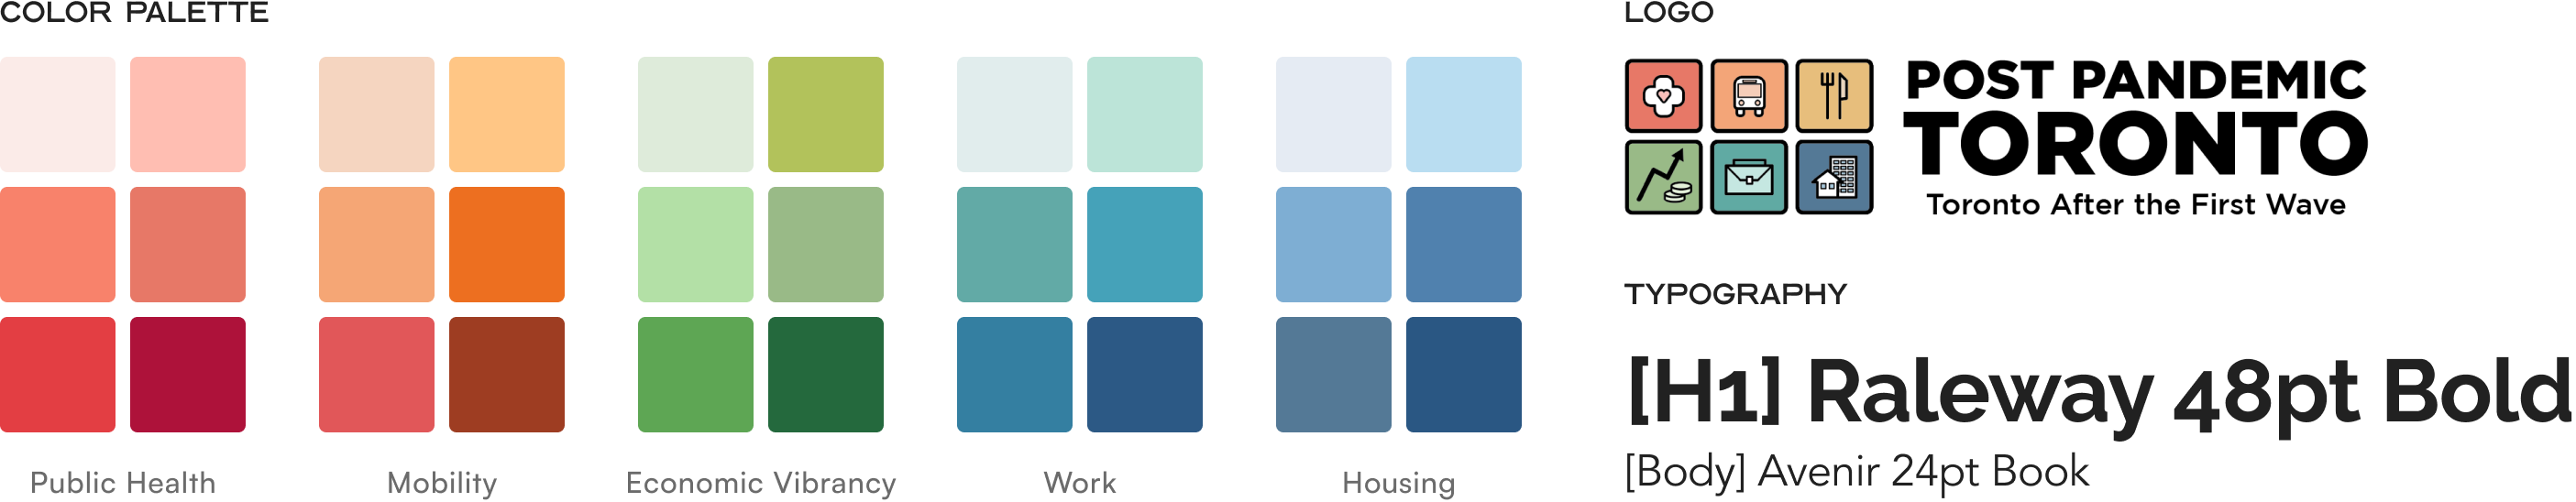
Post Pandemic Toronto
ROLE + CLIENT
UX Design Lead,
University of Toronto
DURATION
8 Weeks
TEAM
Andres Jimenez
Lydia (Youjing) Li
Sadman Hossain
Yash Gupta
PROBLEM
Pandemic data is hard to locate, understand, and interpret
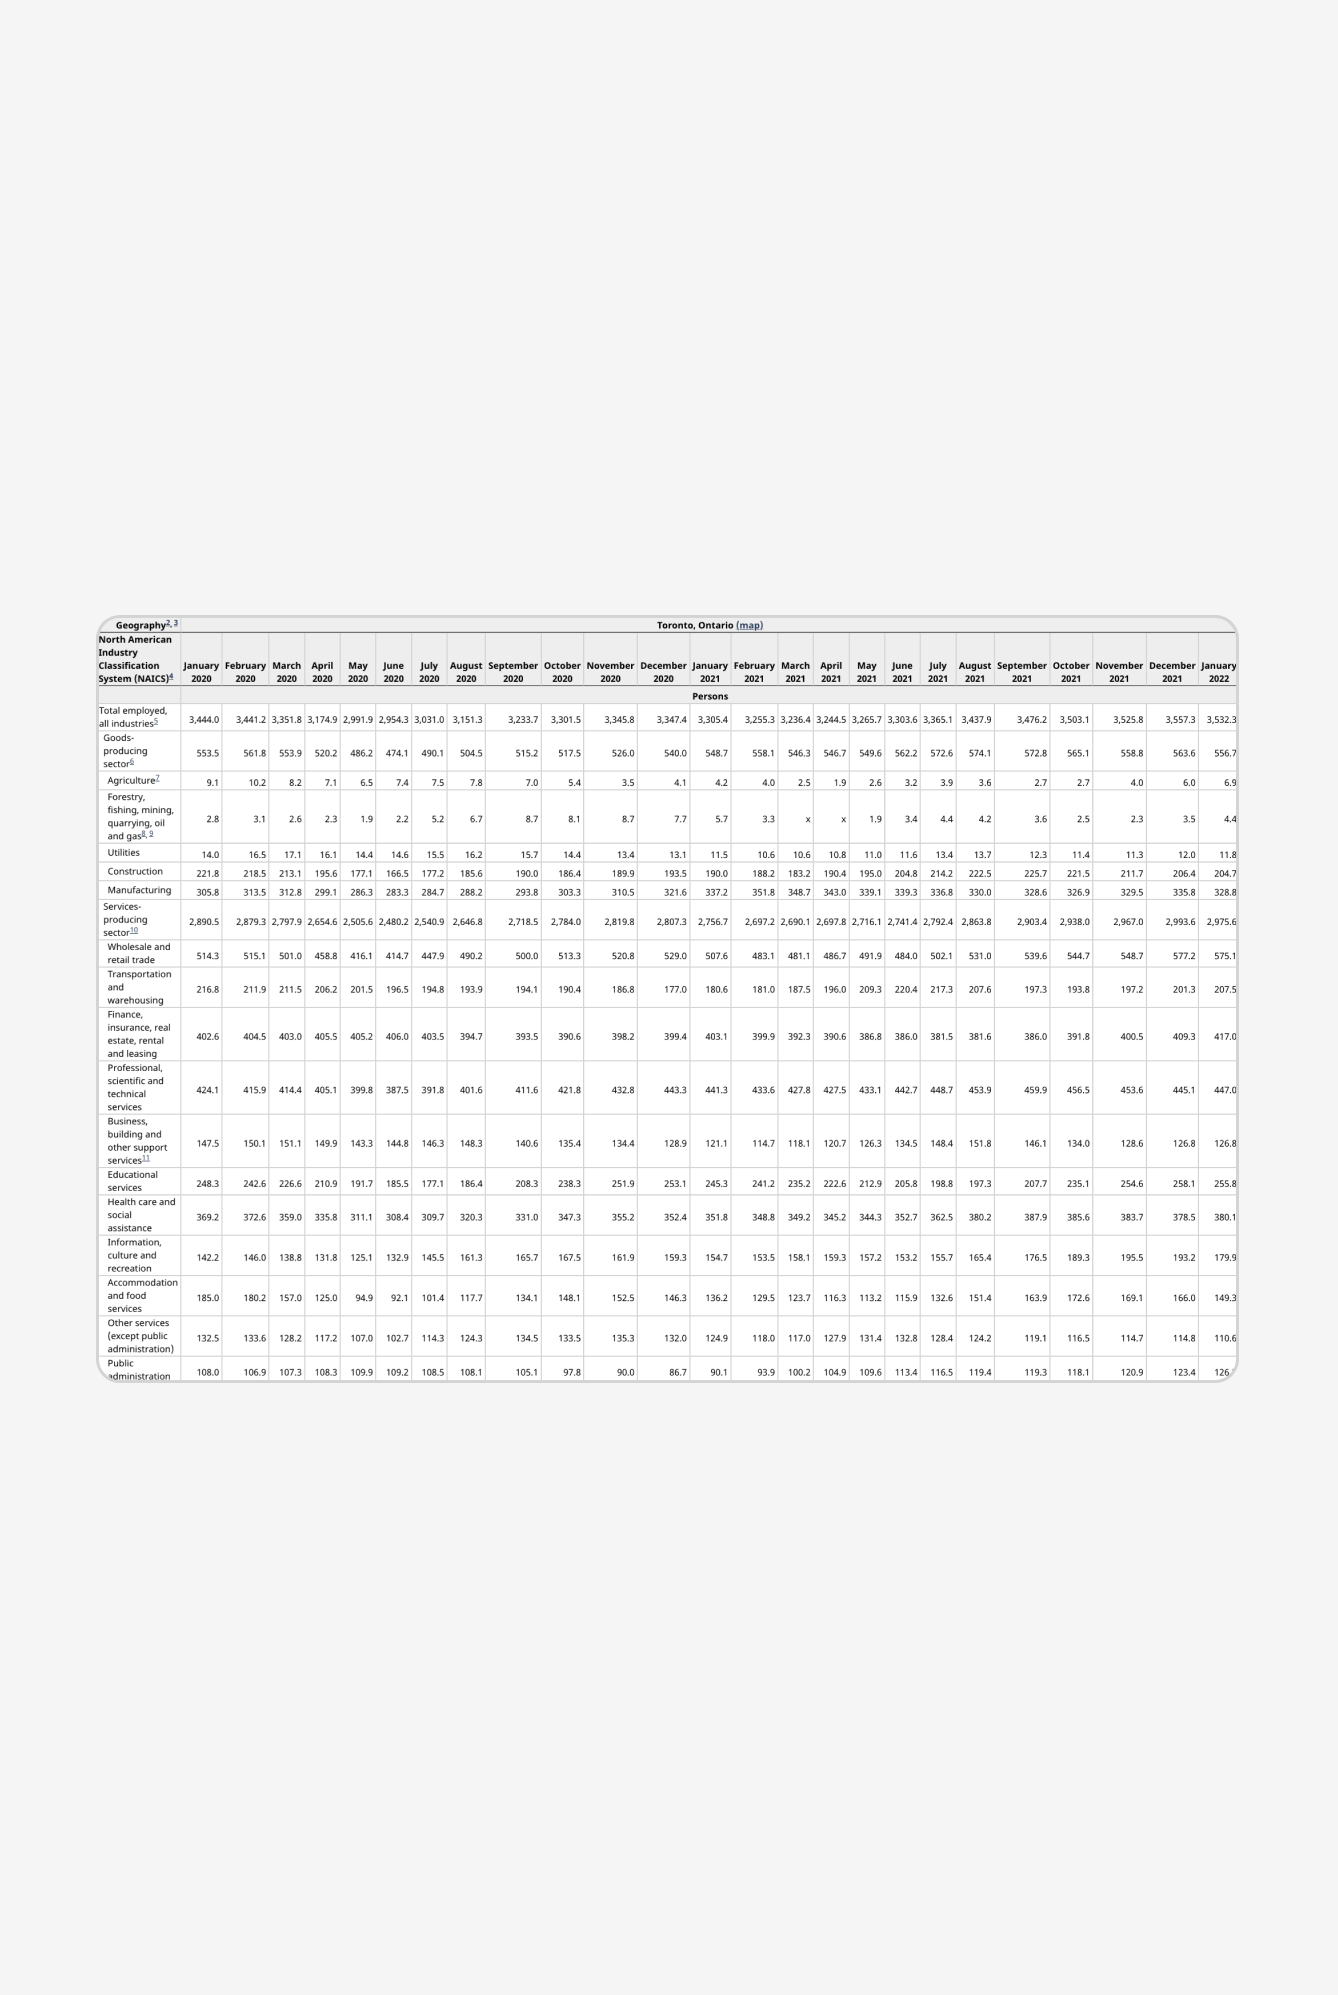
As COVID-19 impacted Toronto, various groups published open-source data to provide information about the city. However, these datasets were isolated, complex, and lacked insight – leading to confusion and low rates of data exploration among the general public.
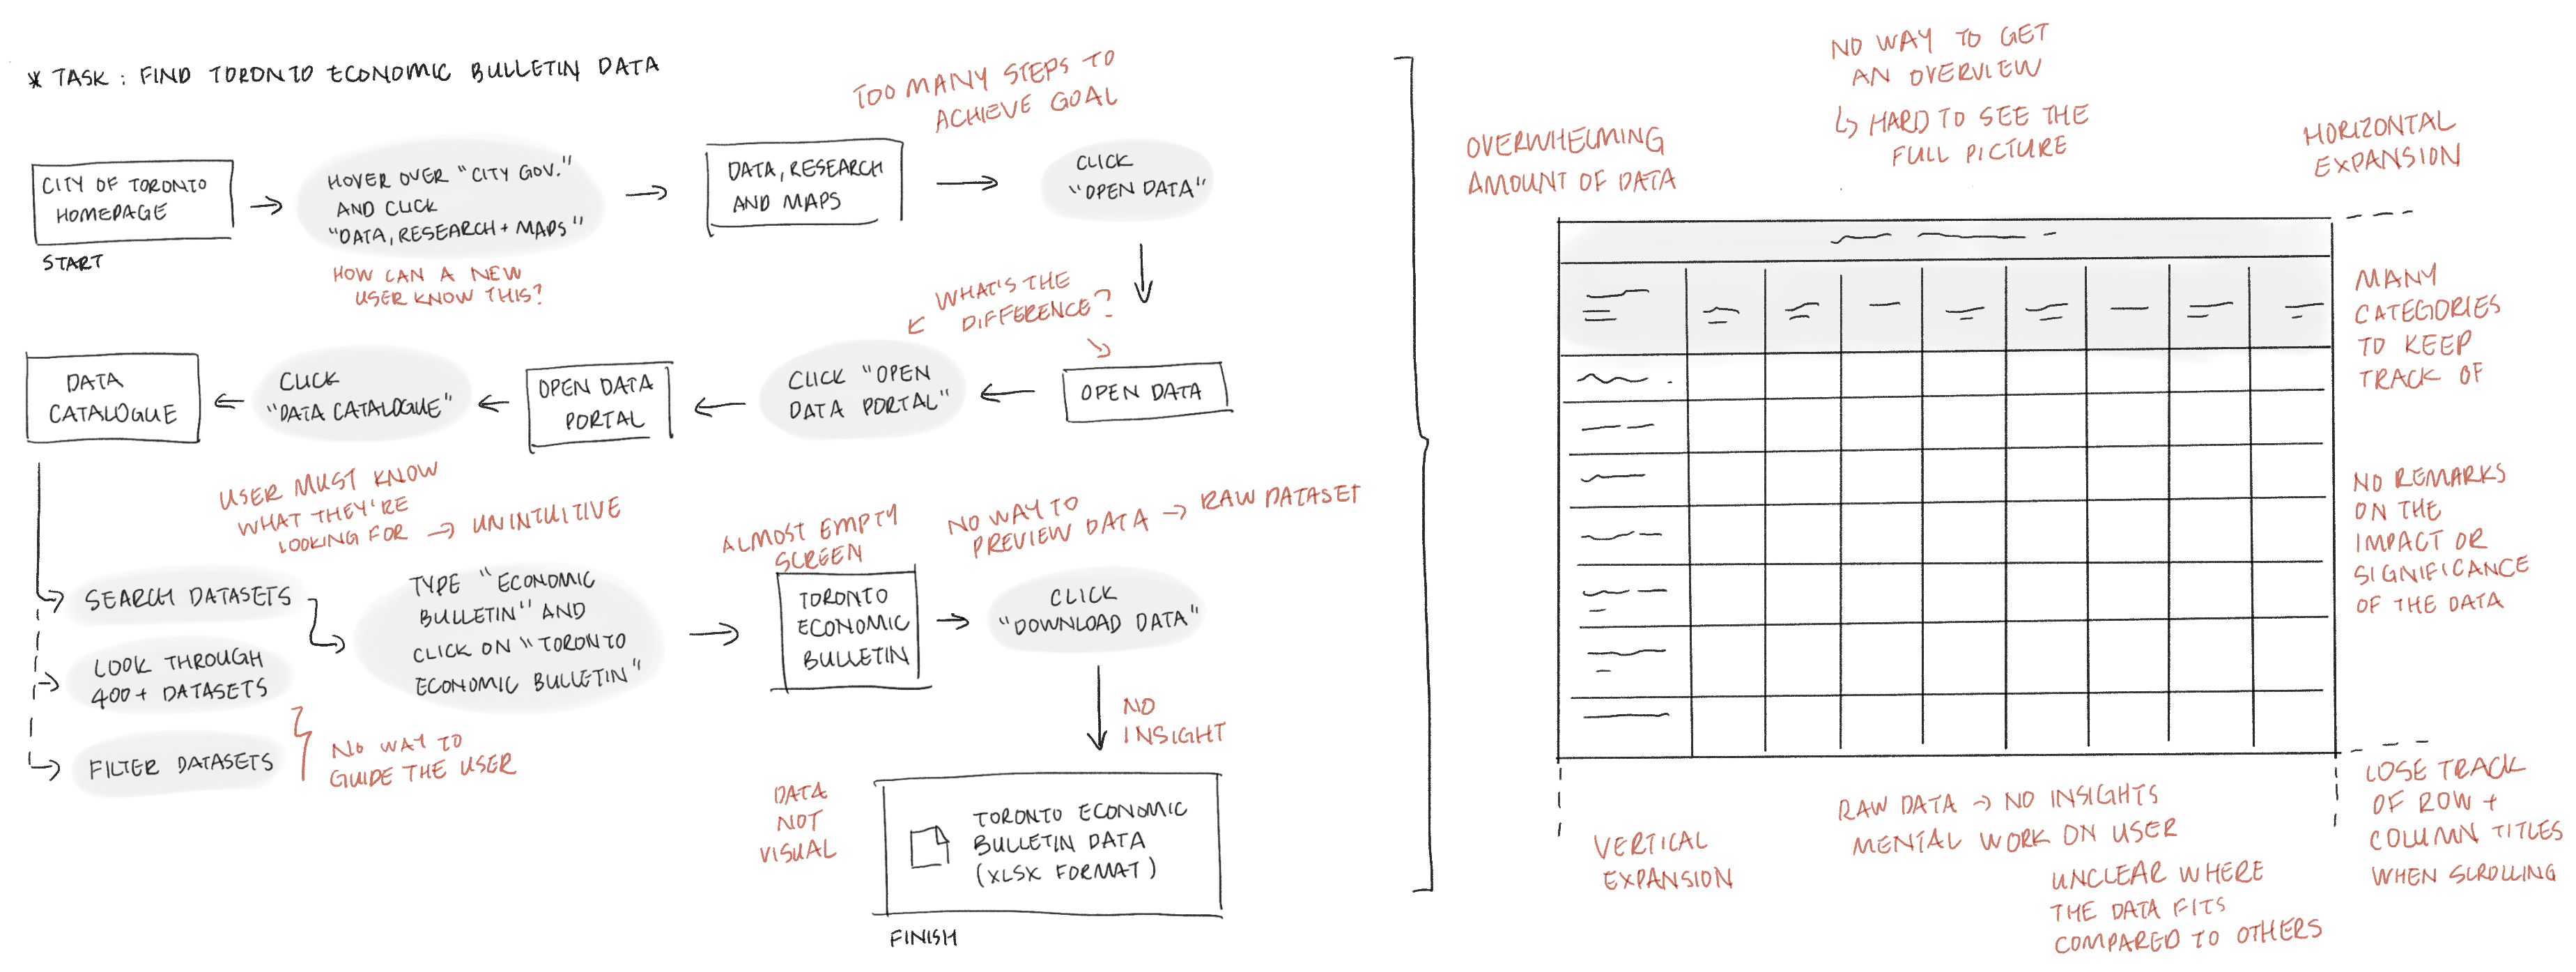
↳ Example user flow and challenges to locating, understanding, and interpreting data
SOLUTION
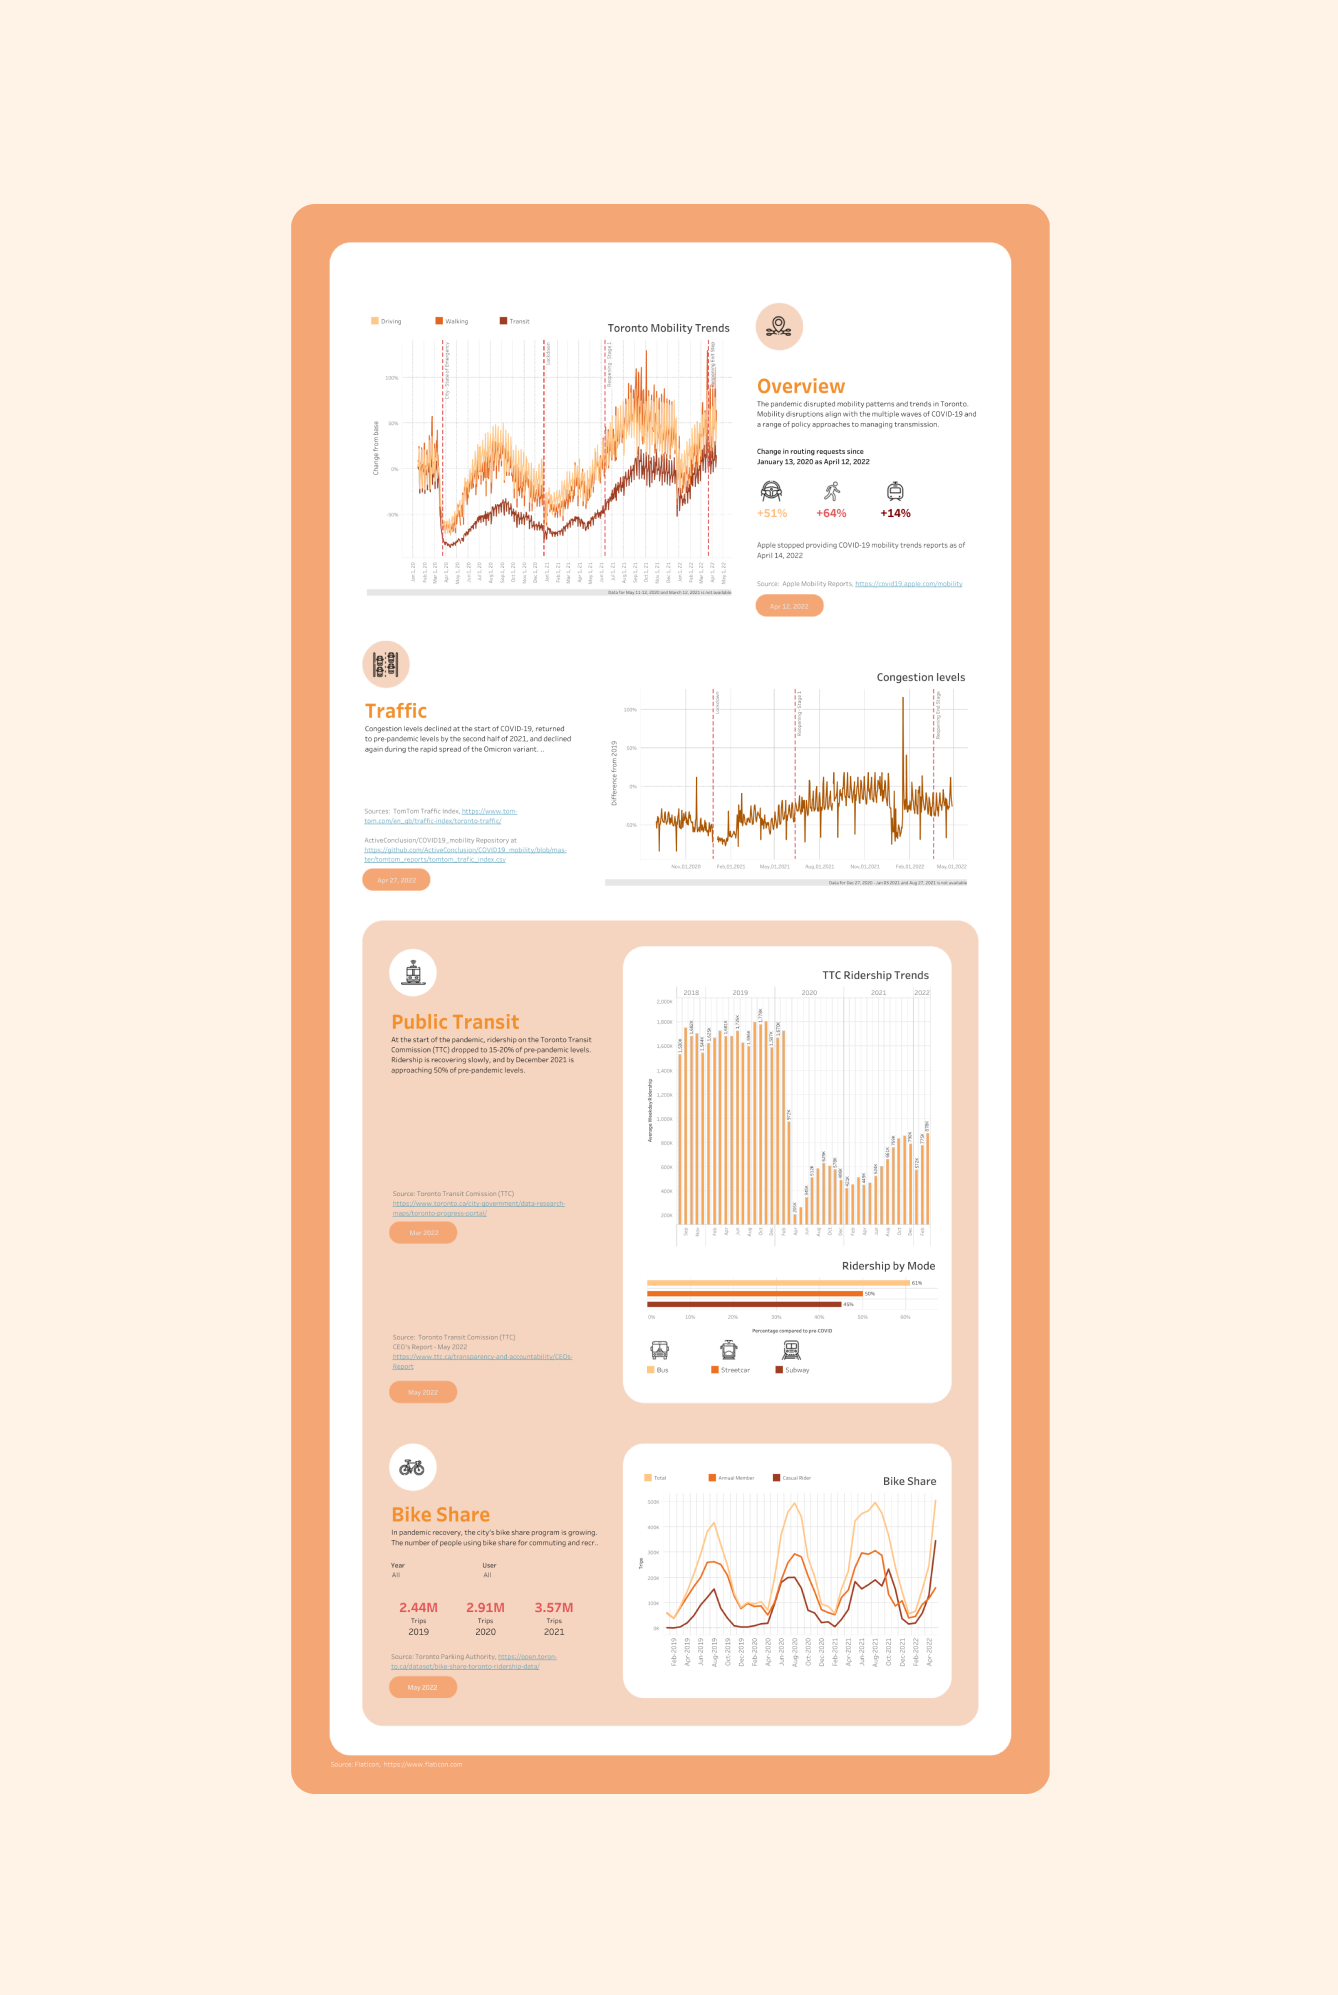
Making COVID-19 datasets simple and insightful for Torontonians
The target users of this project were Torontonians who struggled with data literacy and found the datasets published by governmental entities hard to navigate, complicated, and tedious. Our secondary research showed that exploring datasets and extracting valuable information was important for our users.
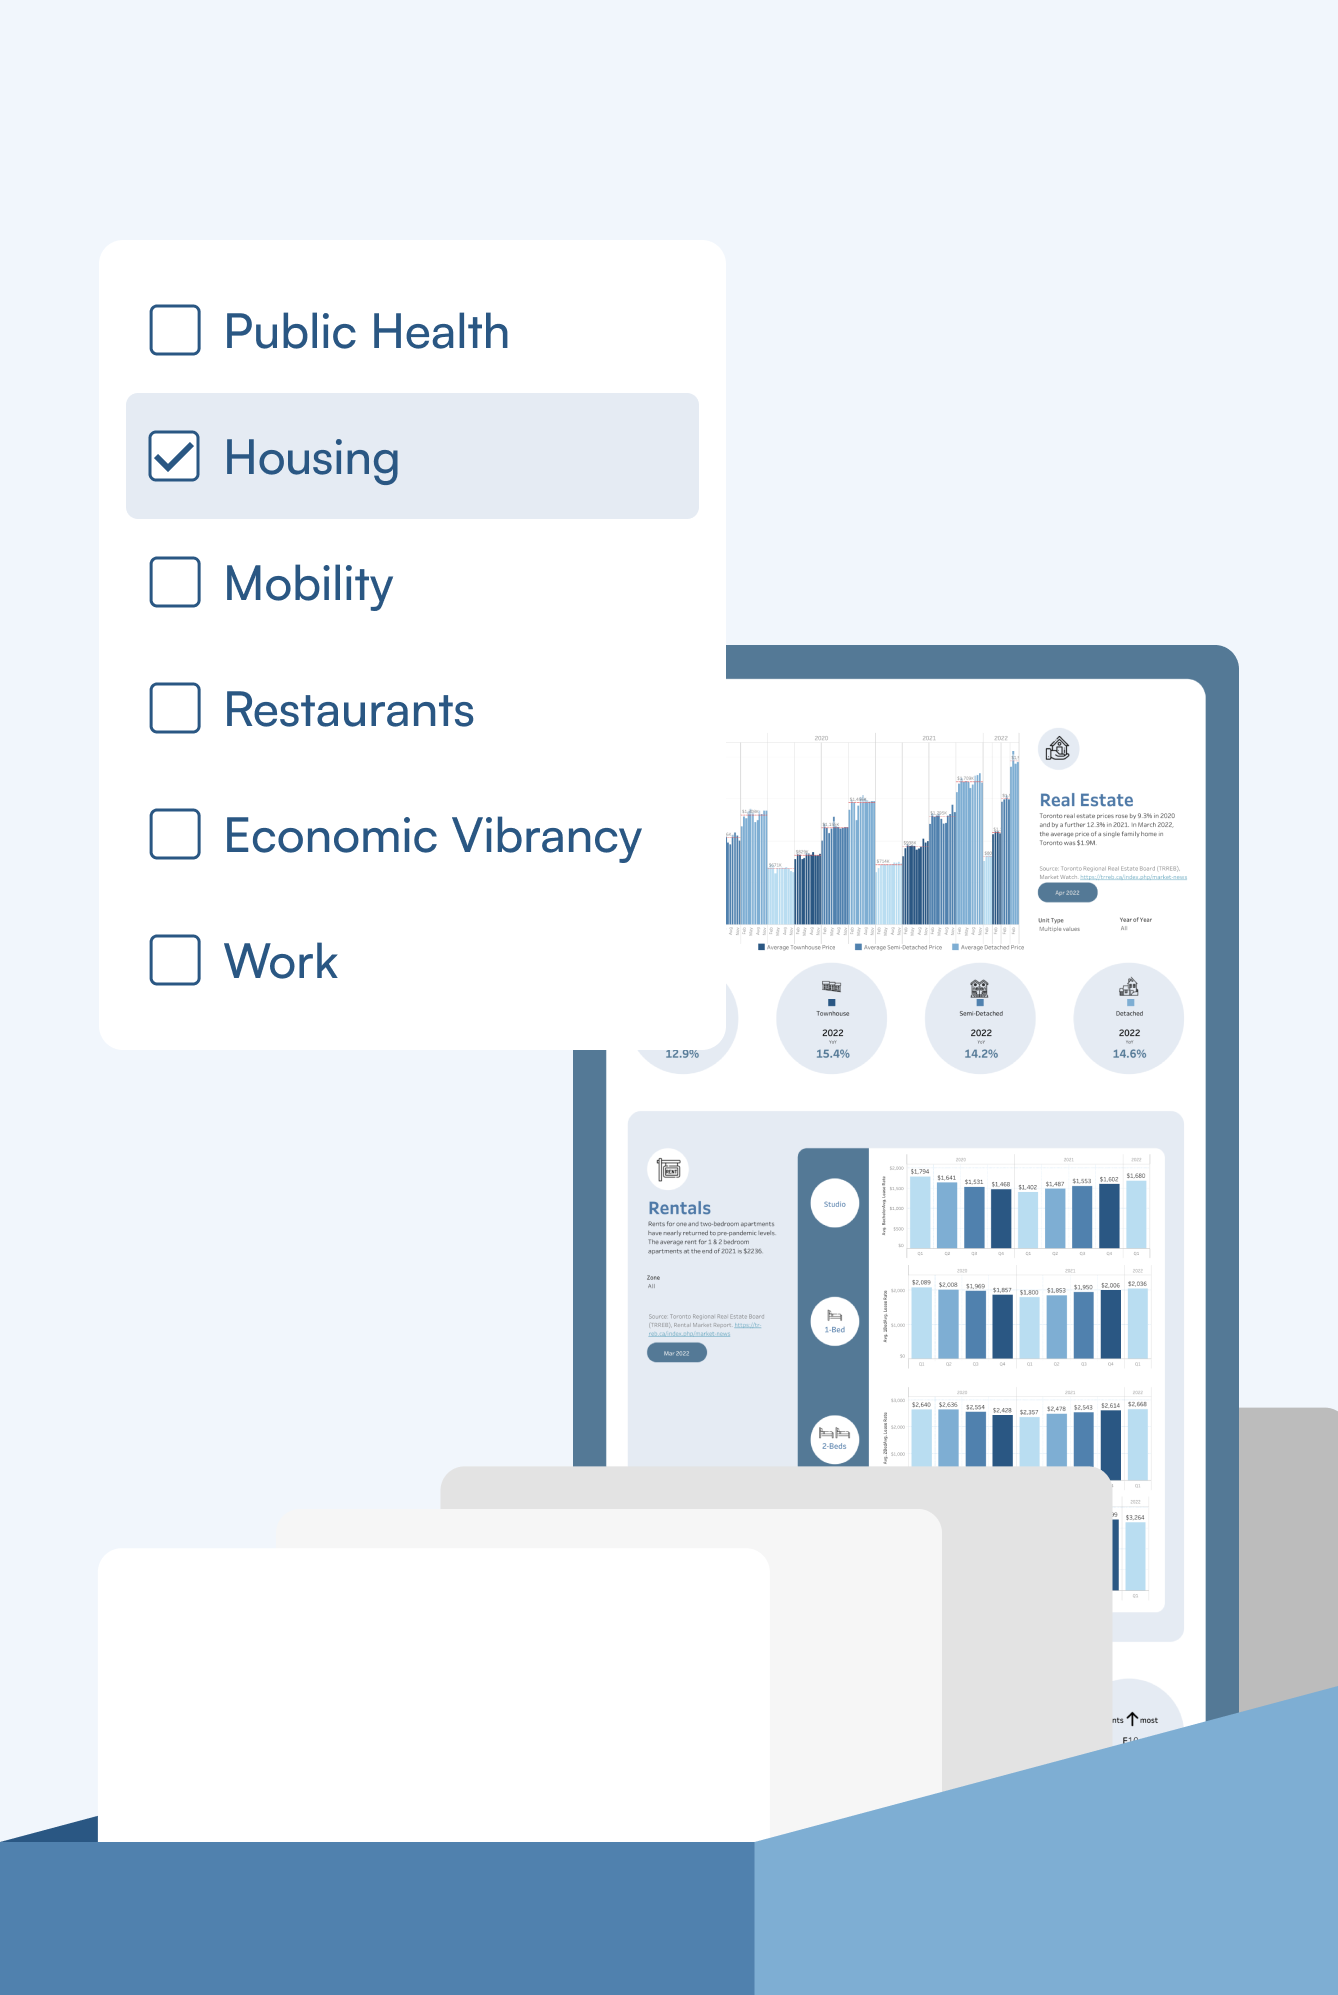
Find simple, reliable, and categorized data – all in one place.
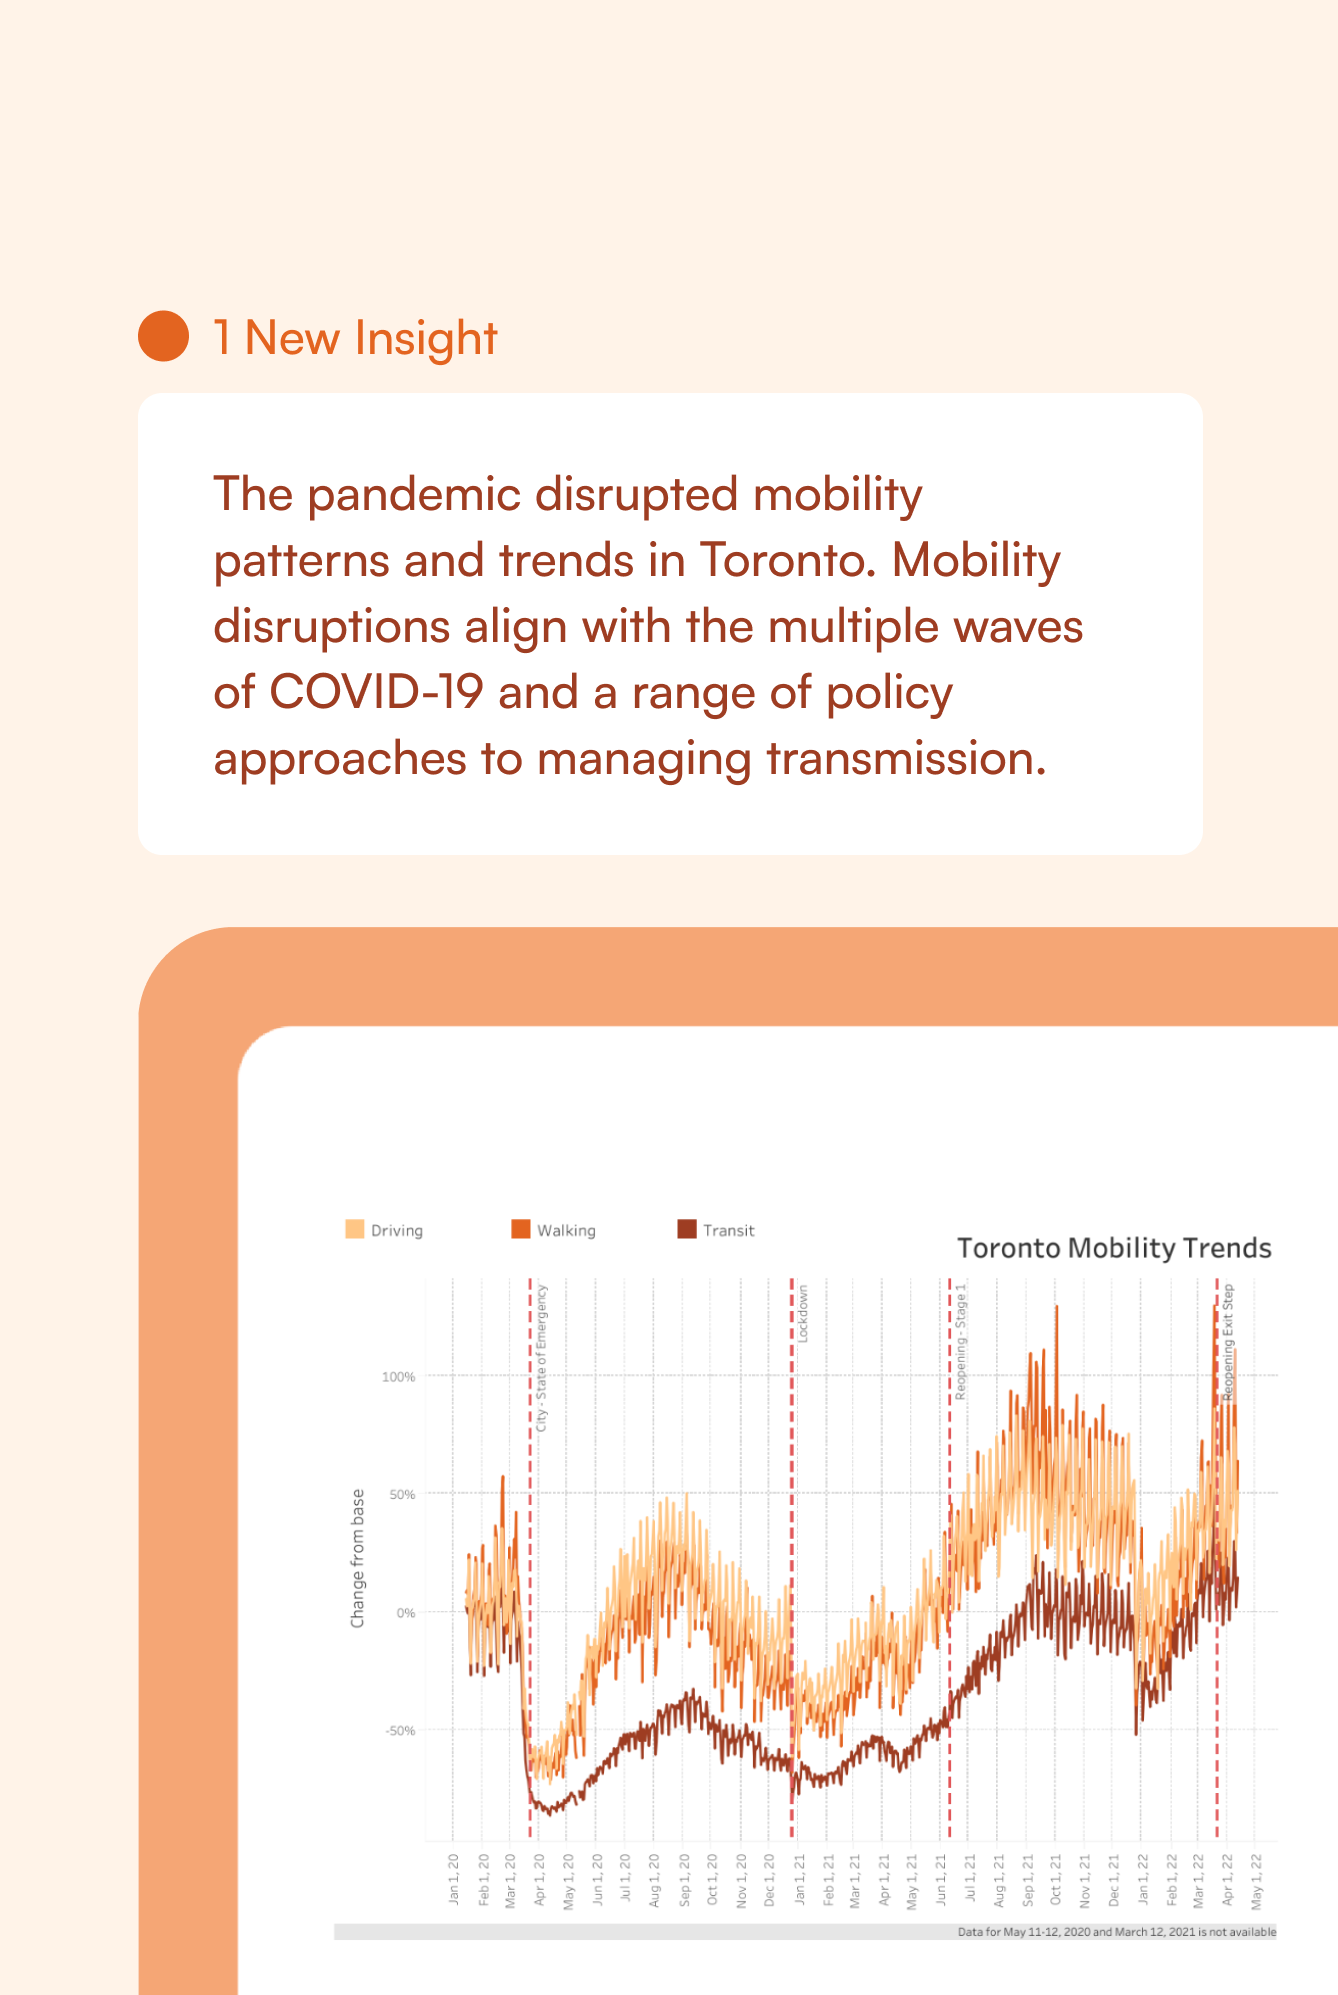
Give data meaning with insights composed by our top researchers.
Explore and interact with visualized data to see Toronto from all perspectives.
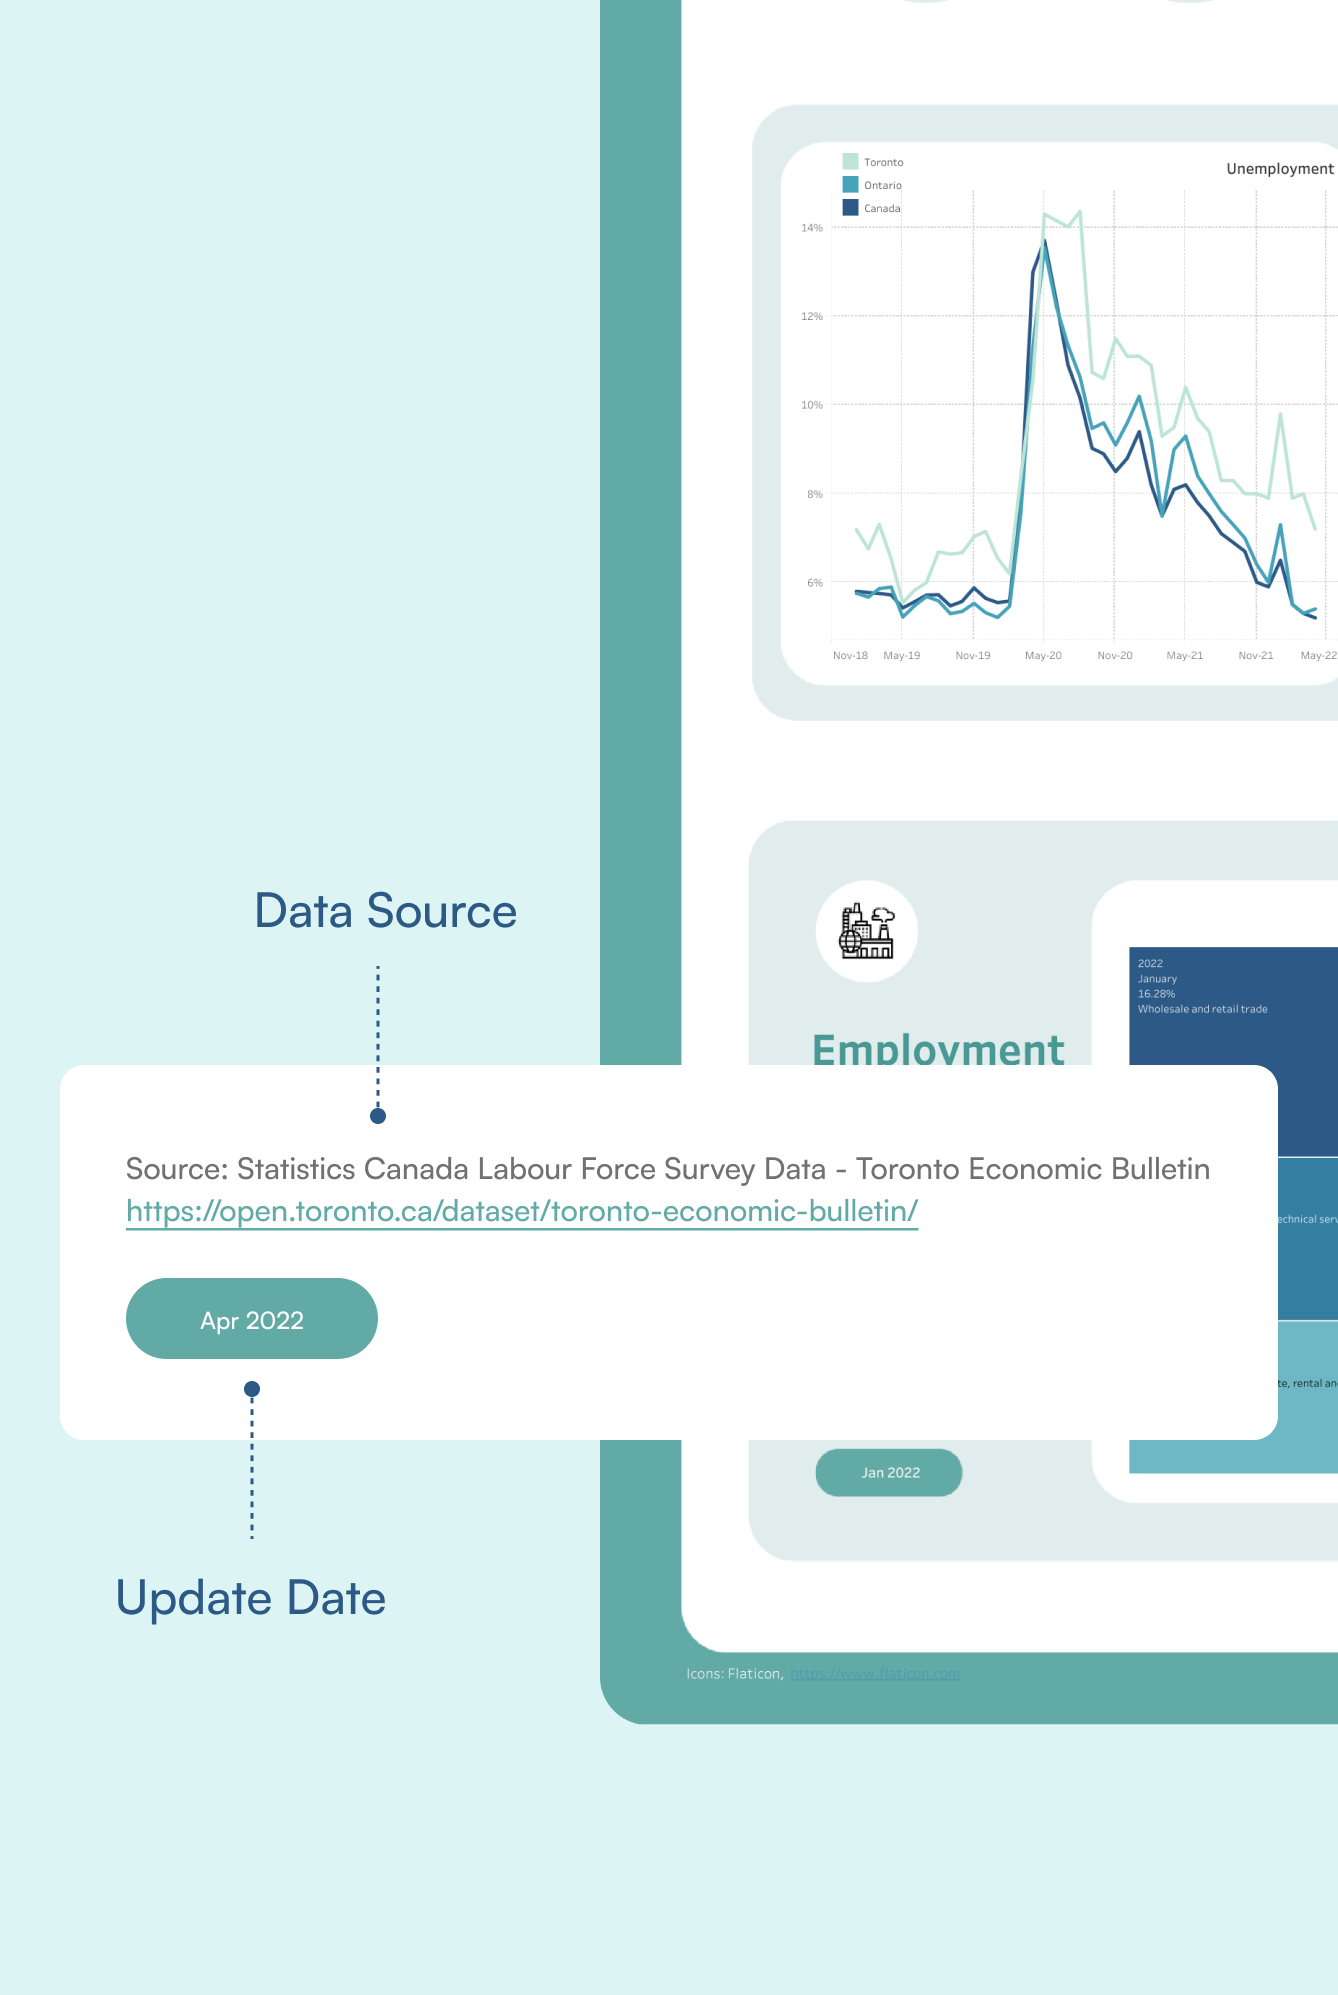
Always know the source and recency of our data to keep updated.
PROCESS
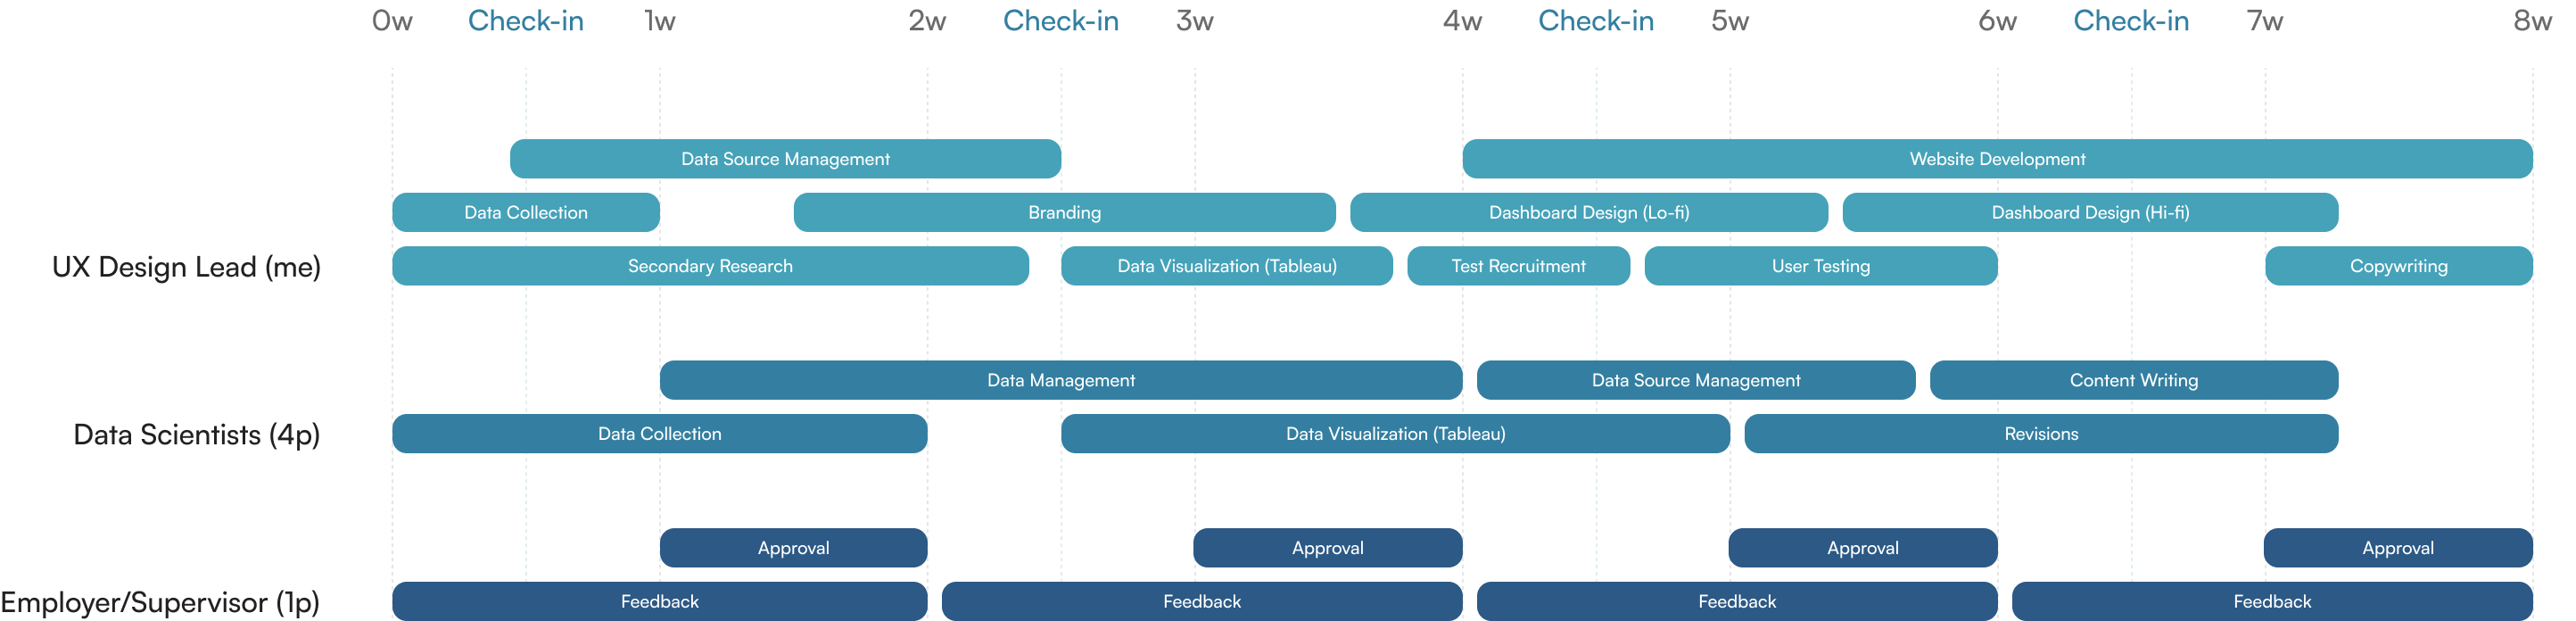
Working effectively with data scientists
As the UX Design Lead, I collaborated with several Data Scientists to iterate on and test possible improvements to organize, simplify, and present the data they gathered. Moreover, I took the initiative to improve and elevate our product by addressing various challenges.
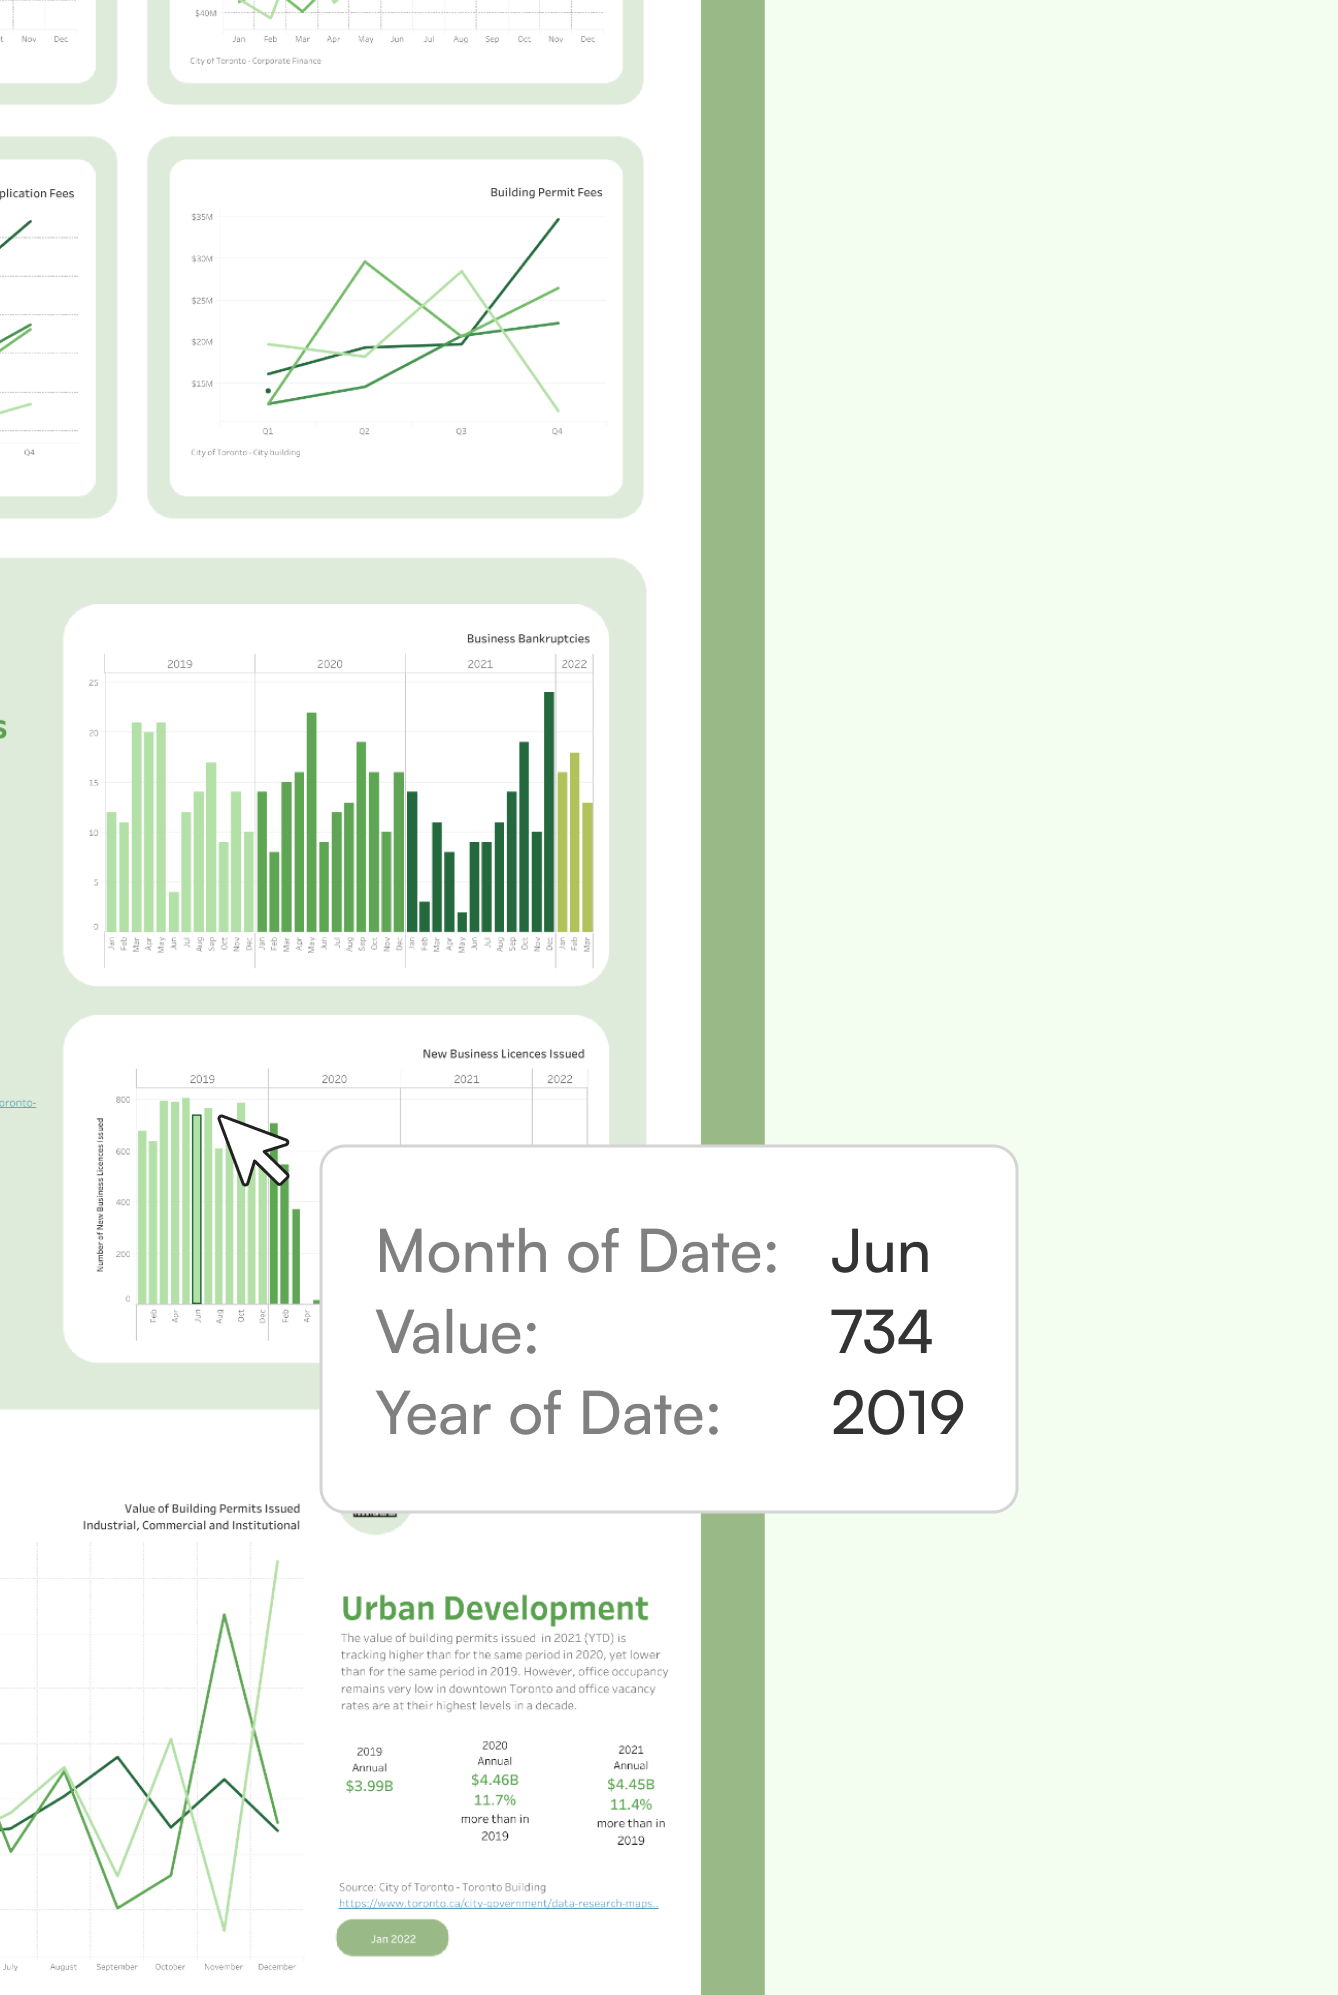
Phase 1: Dataset Management, Data Sci.
Phase 2: Data Viz, Data Sci. + UXD Lead
Phase 3: Dashboard Design, UXD Lead
⎯ CHALLENGE 1
Deciding what data to include in dashboards
Selecting relevant data and optimizing visualization workflow for dashboards was initially a challenge for my team due to the abundance of open data in Toronto. However, through iteration, we were able to identify and display only the most important data, resulting in a more effective dashboard for users.
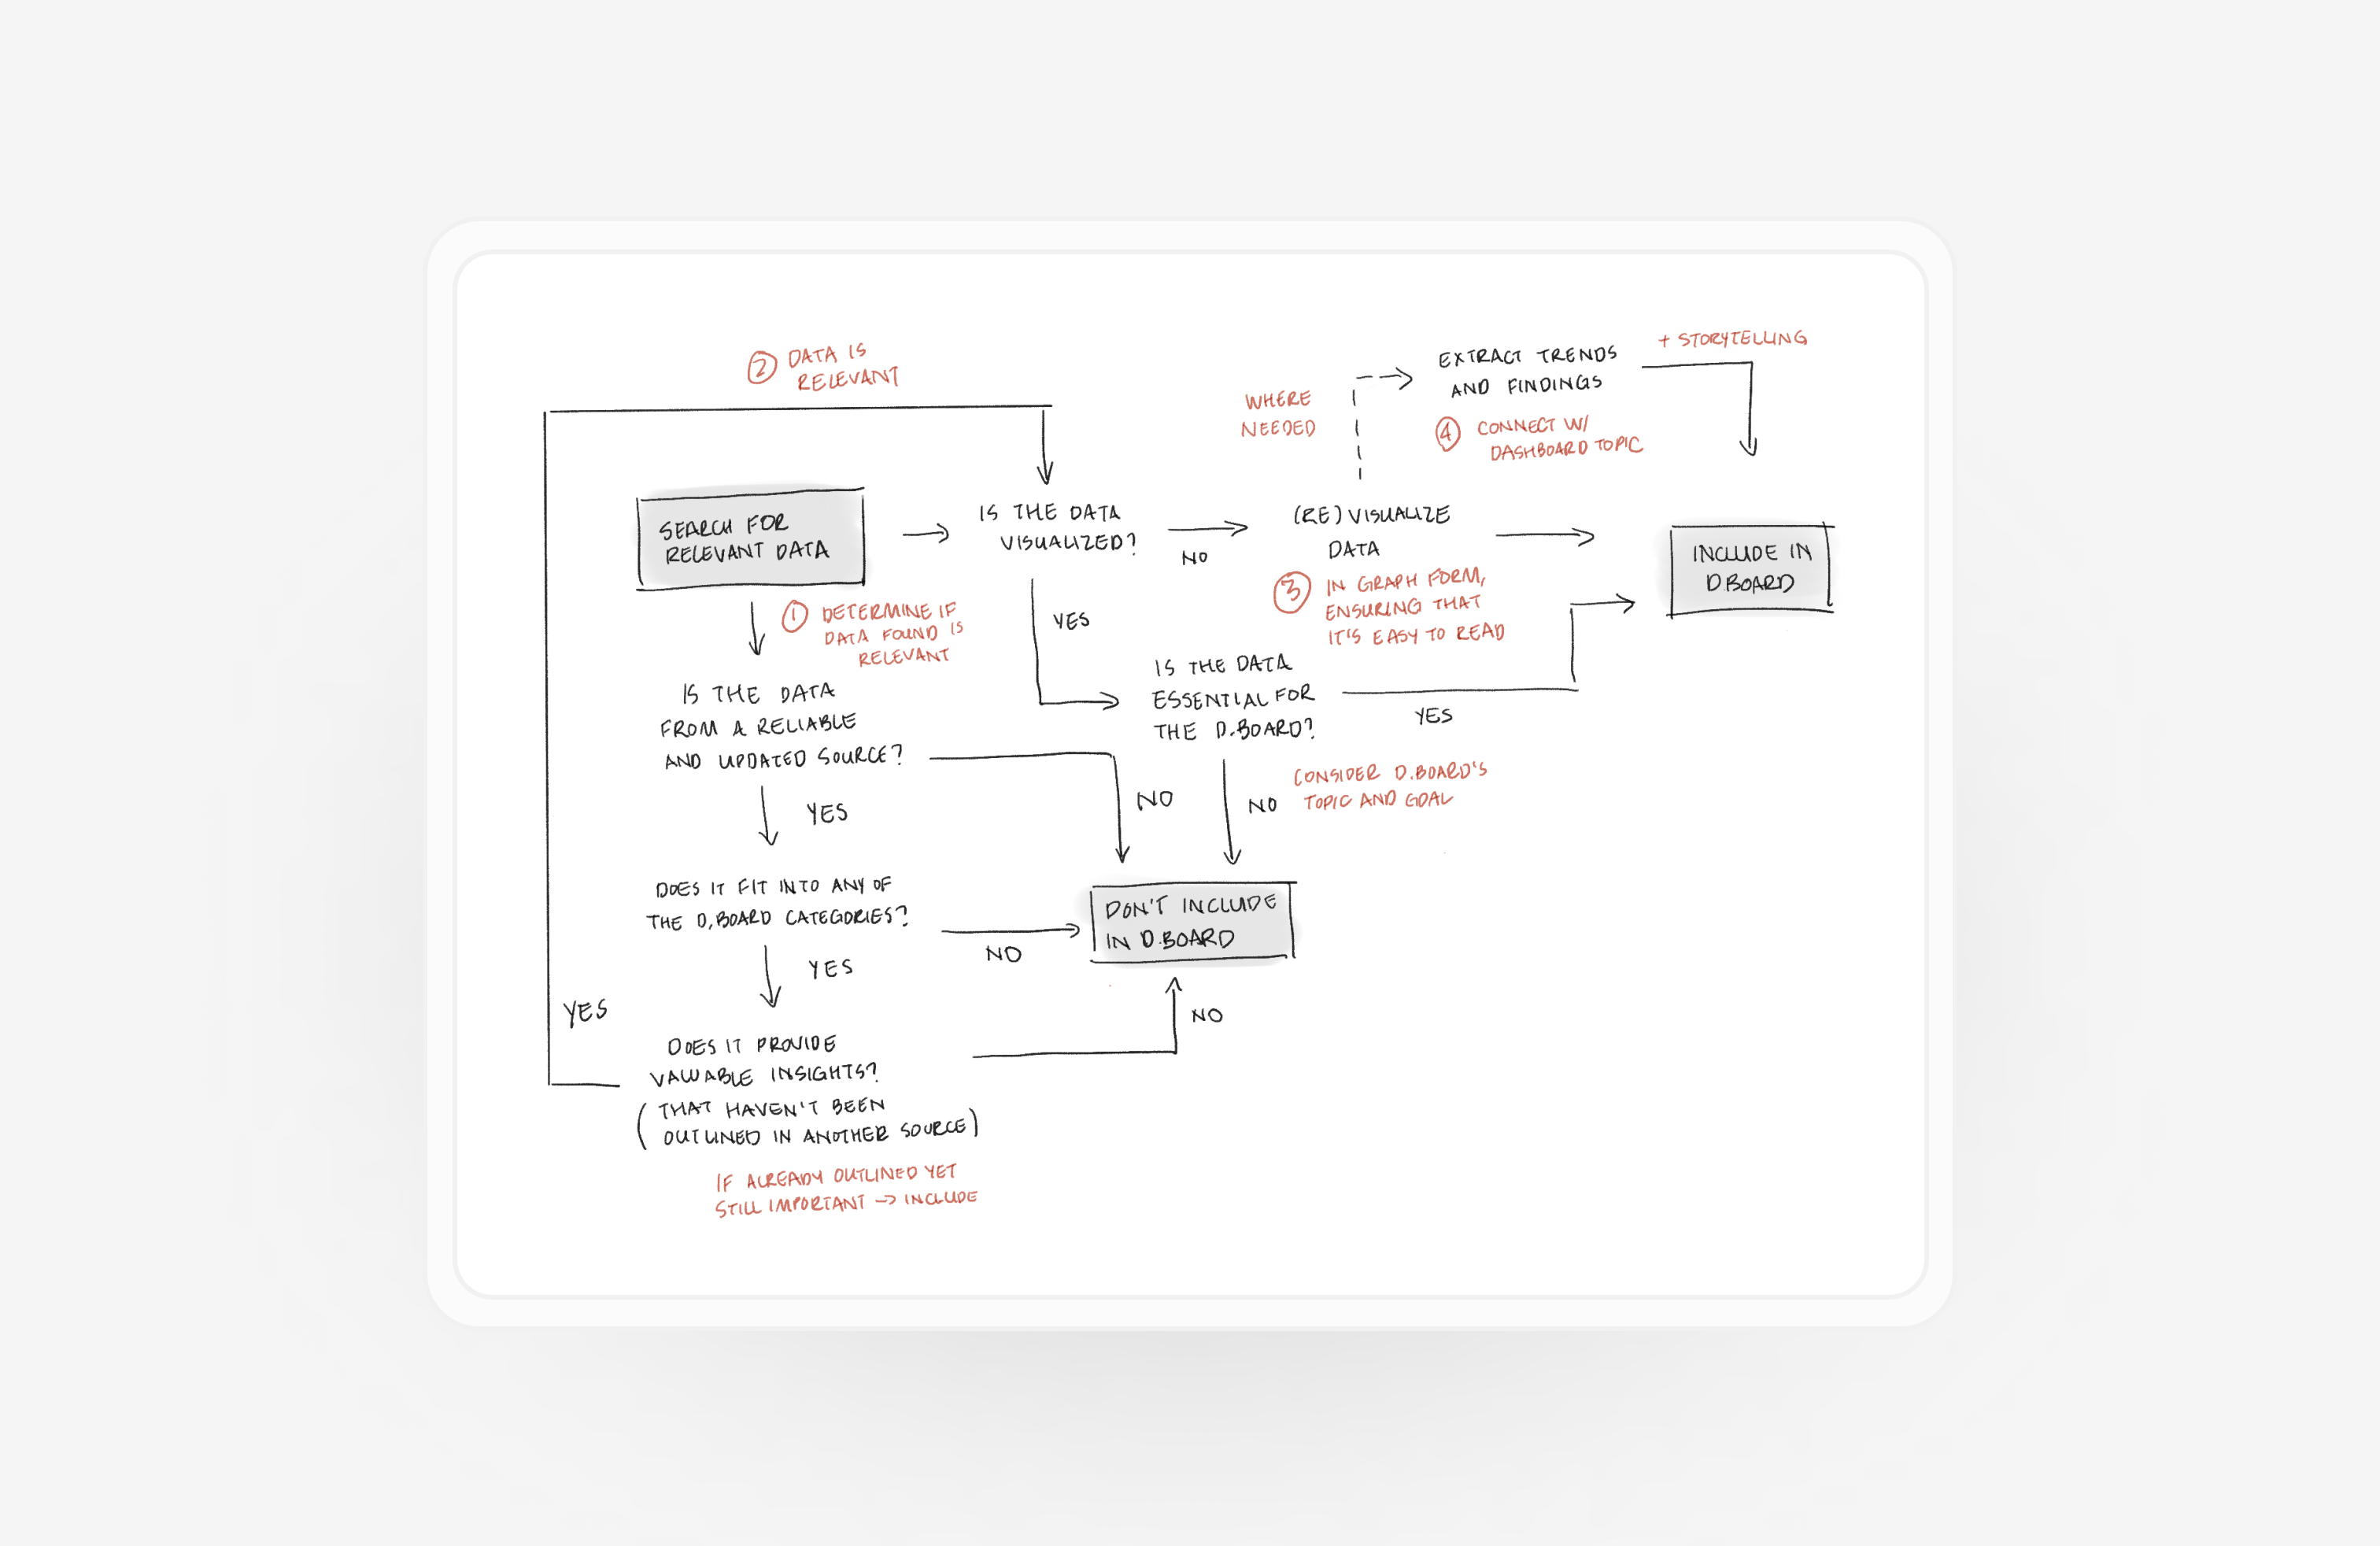

↳ [Test Result] Users preferred to see short, simple, and focused dashboards with fewer data.
⎯ CHALLENGE 2
Addressing the limited funding for user research and testing
By taking the initiative and utilizing my network, I conducted user tests (a/b testing + moderated usability testing) and gathered valuable insights despite limited funding. This proactive approach significantly improved the design and overall effectiveness of the project.
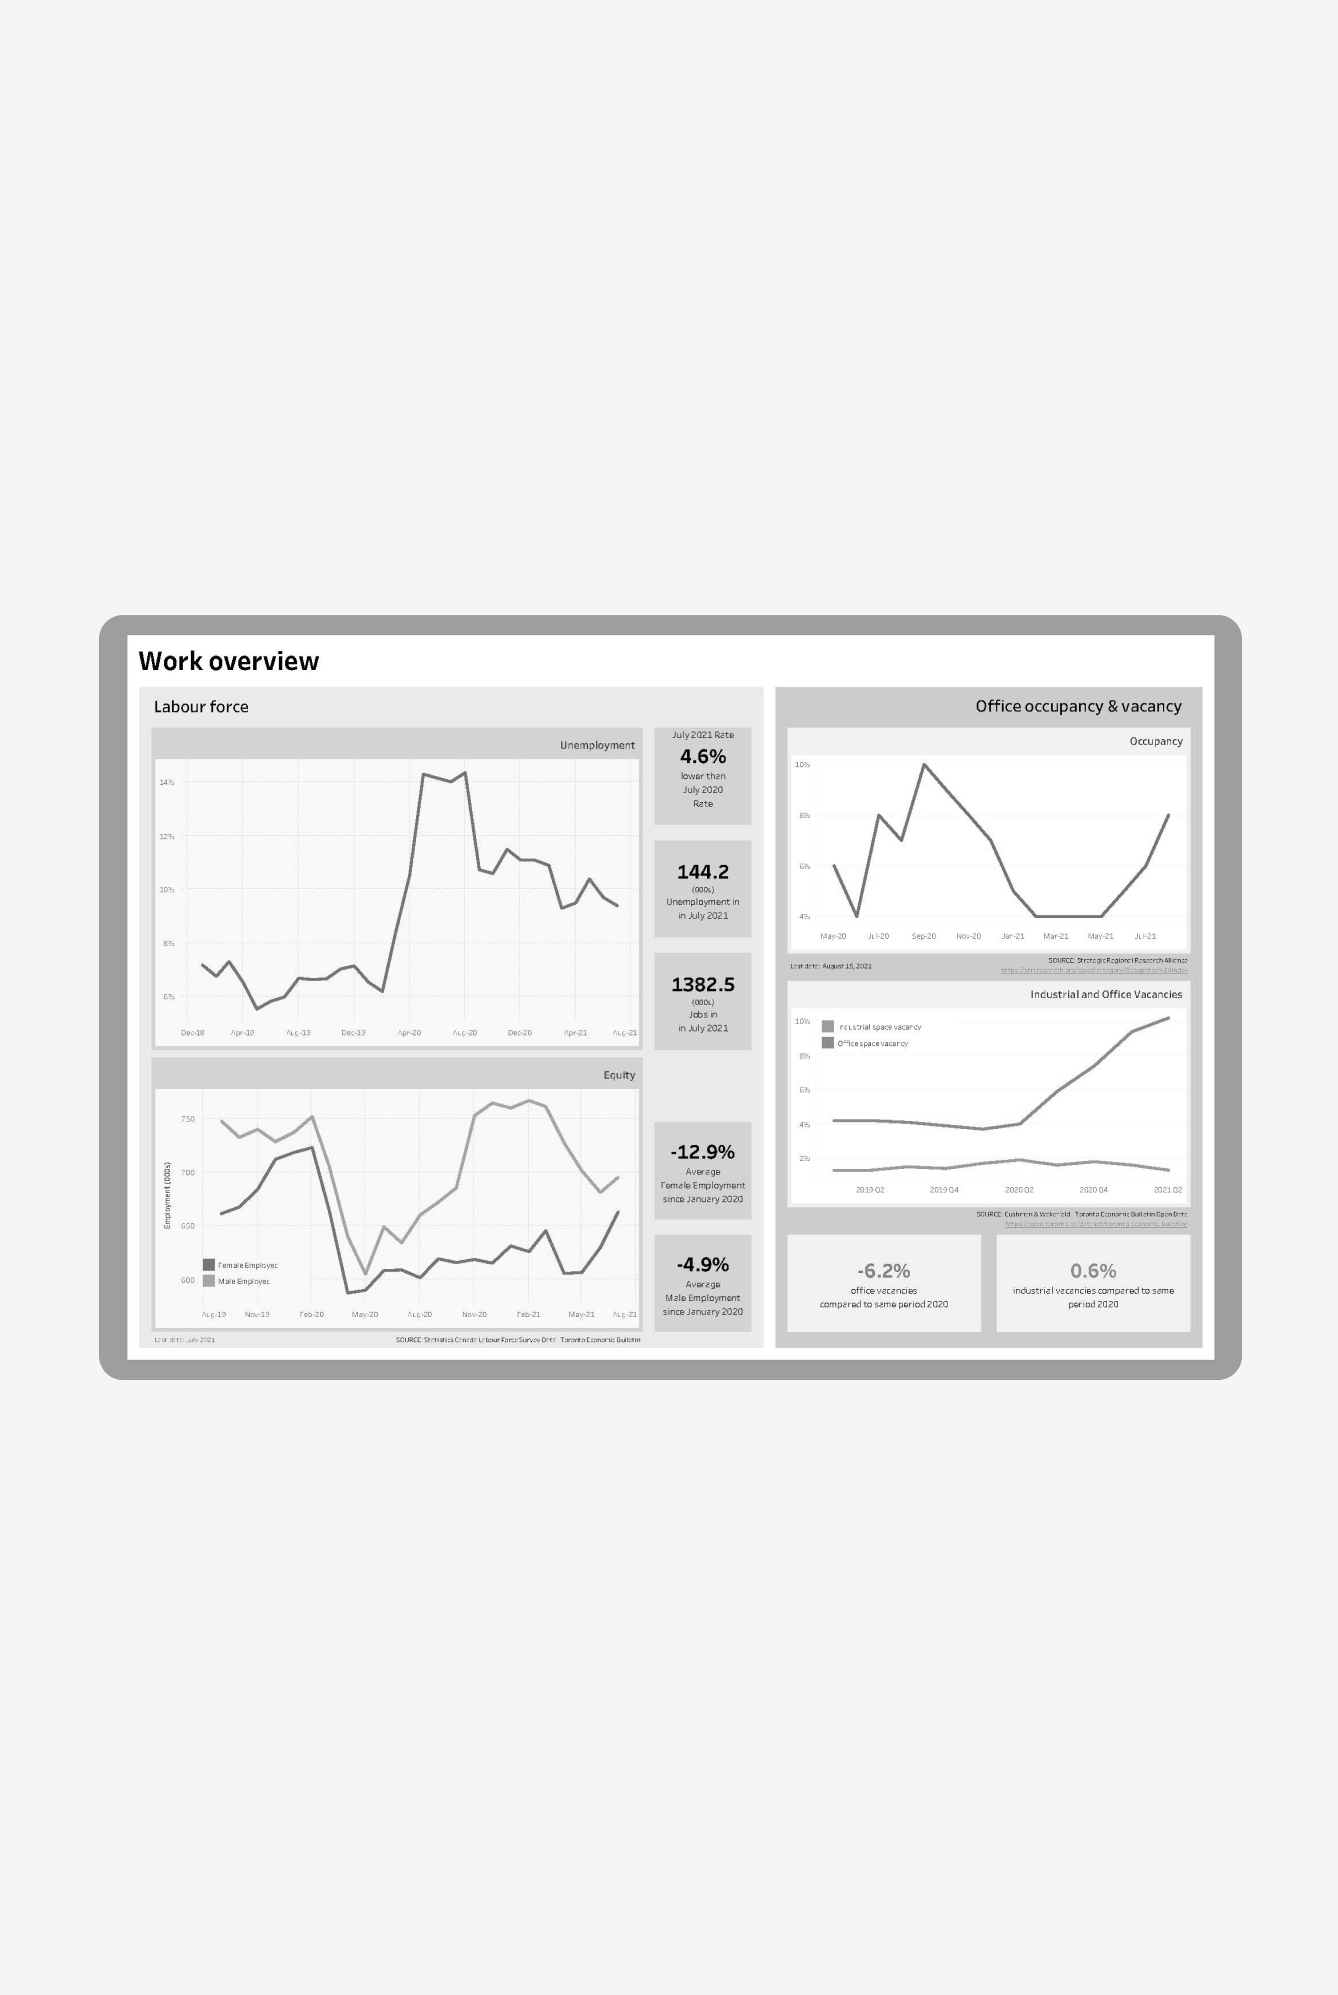
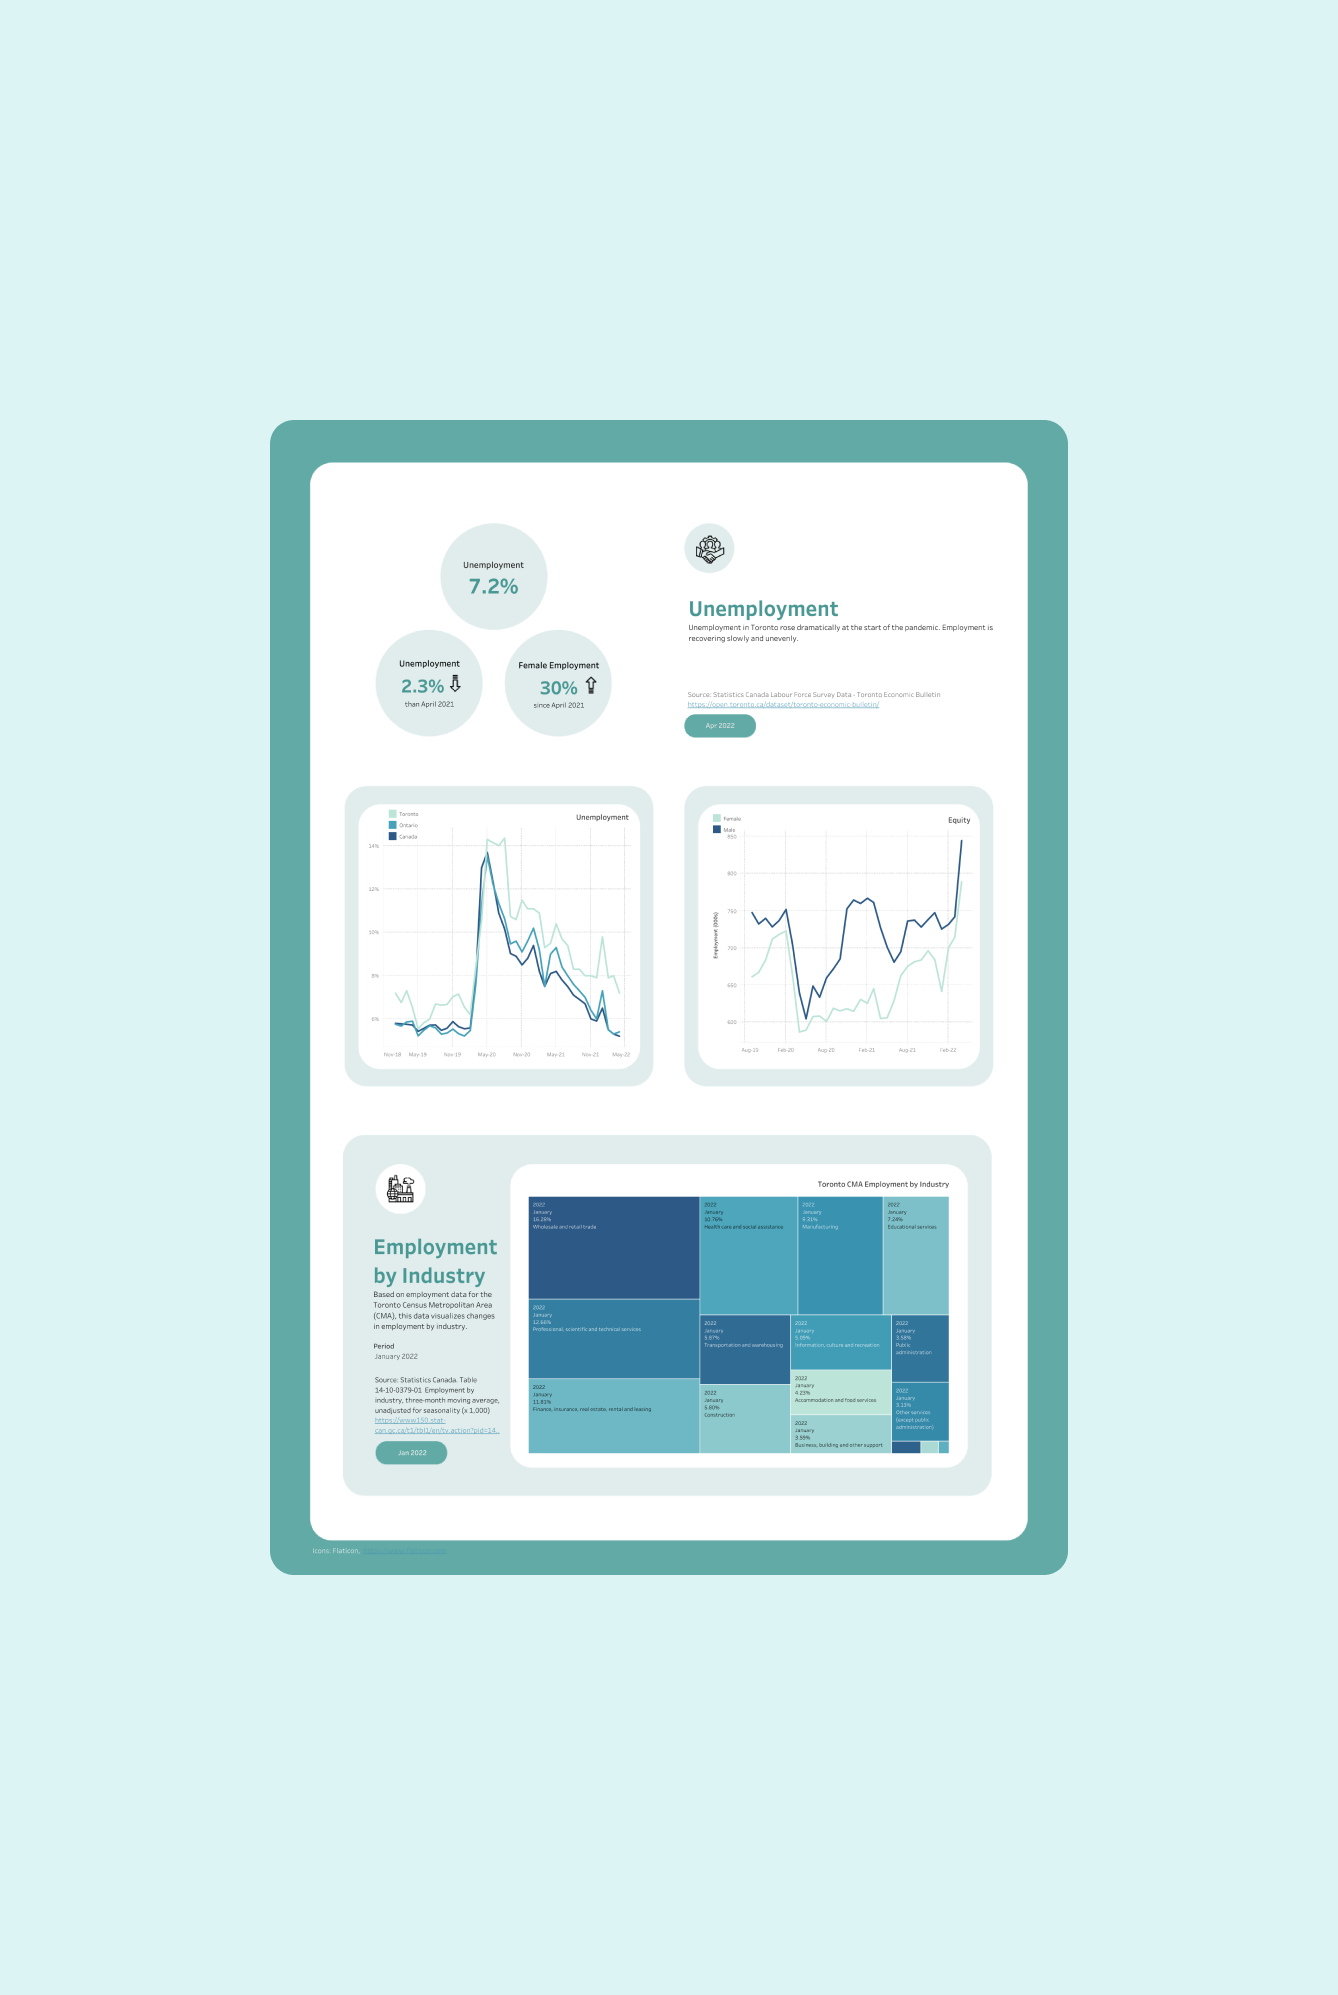
↳ [Test Result] Users had trouble reading and digesting data with a horizontal layout. Therefore, we utilized a vertical layout that is easier to read, navigate, and explore.
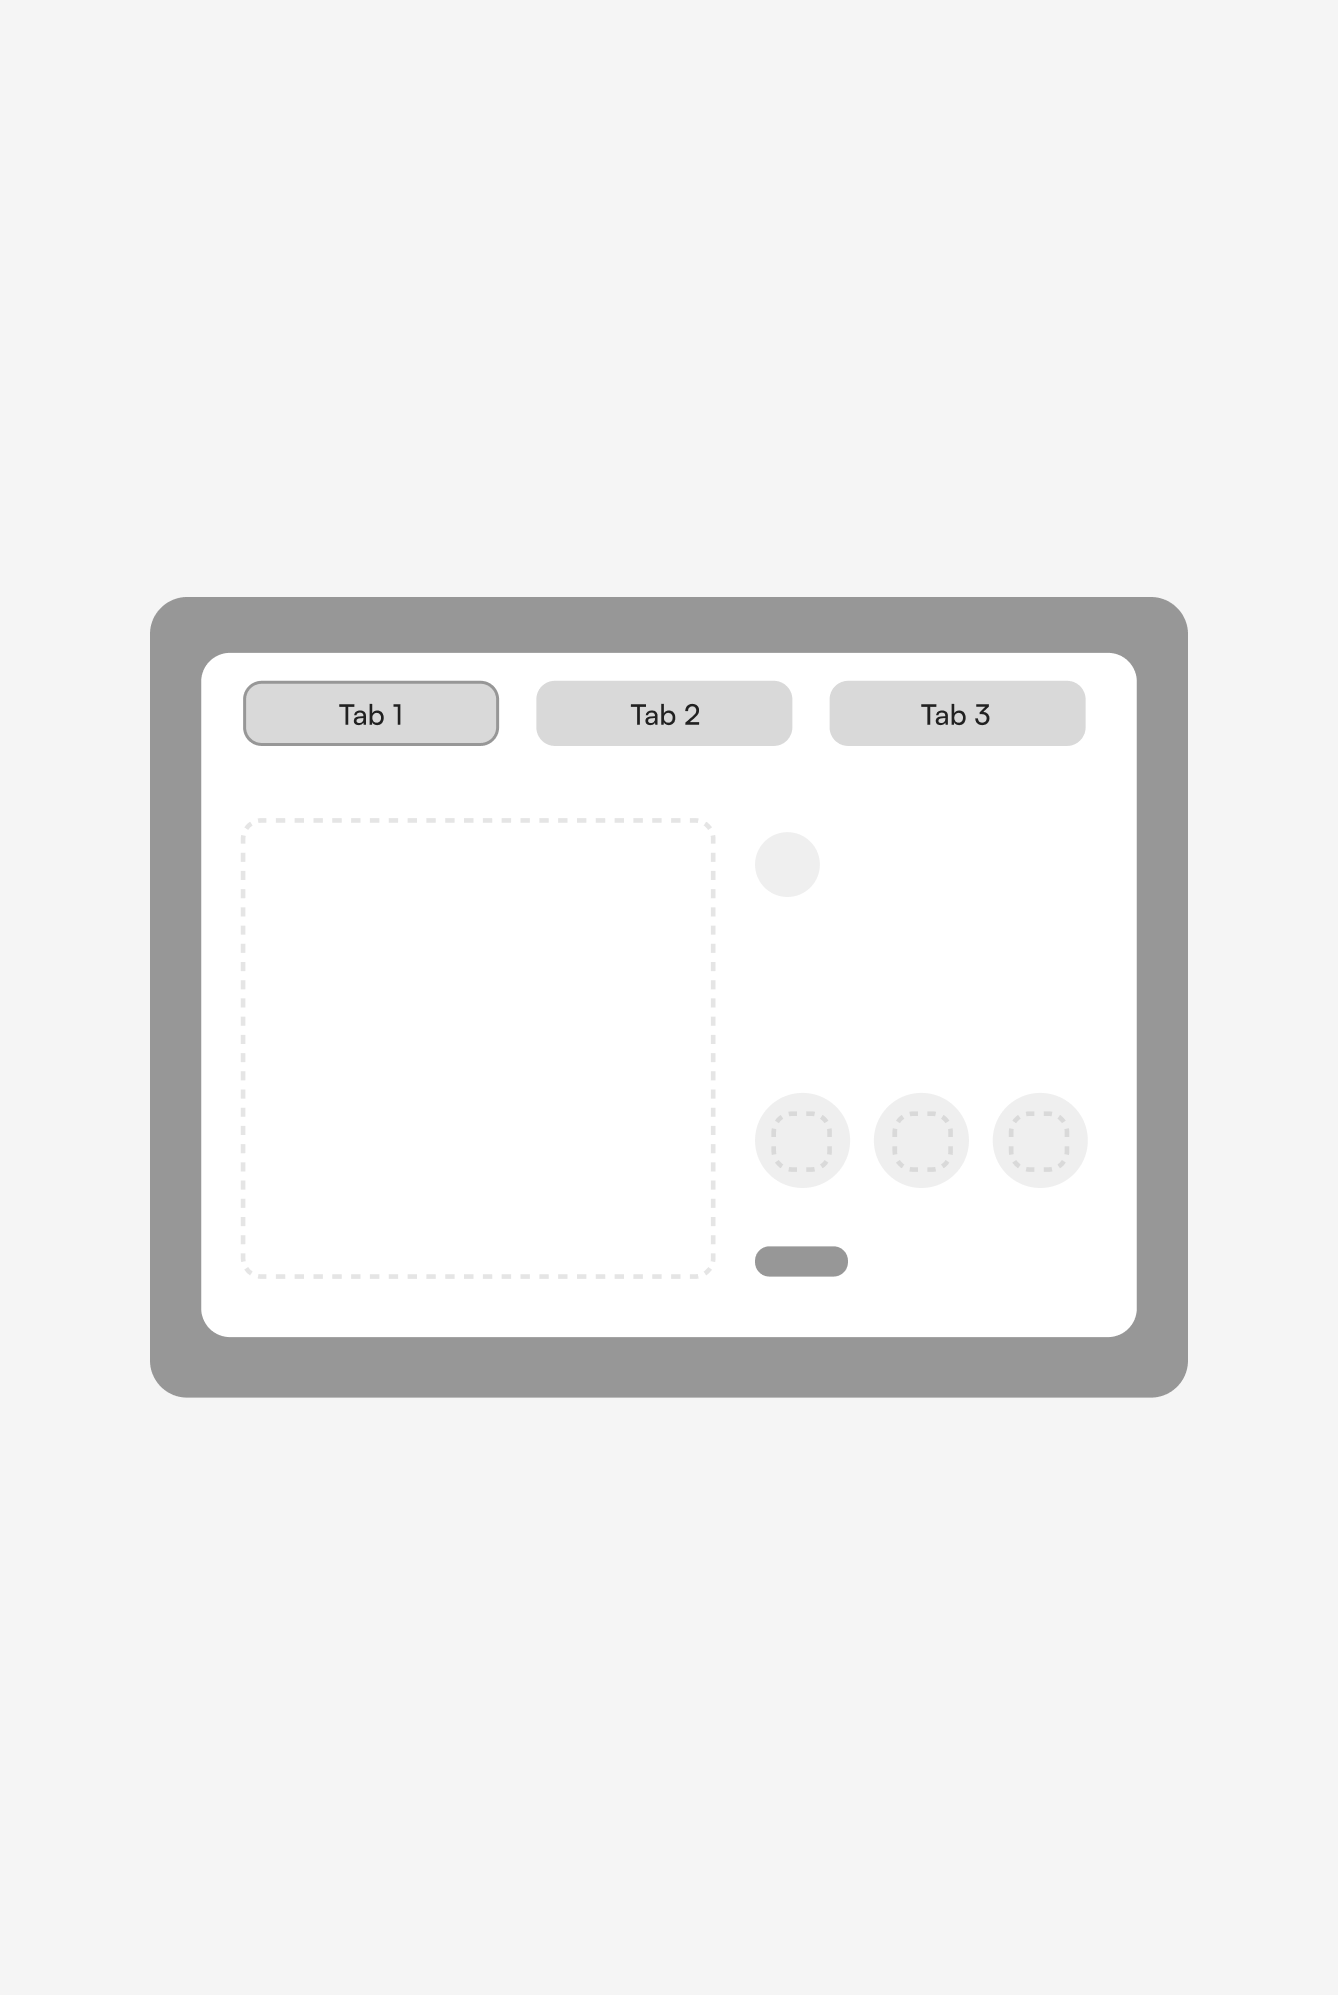
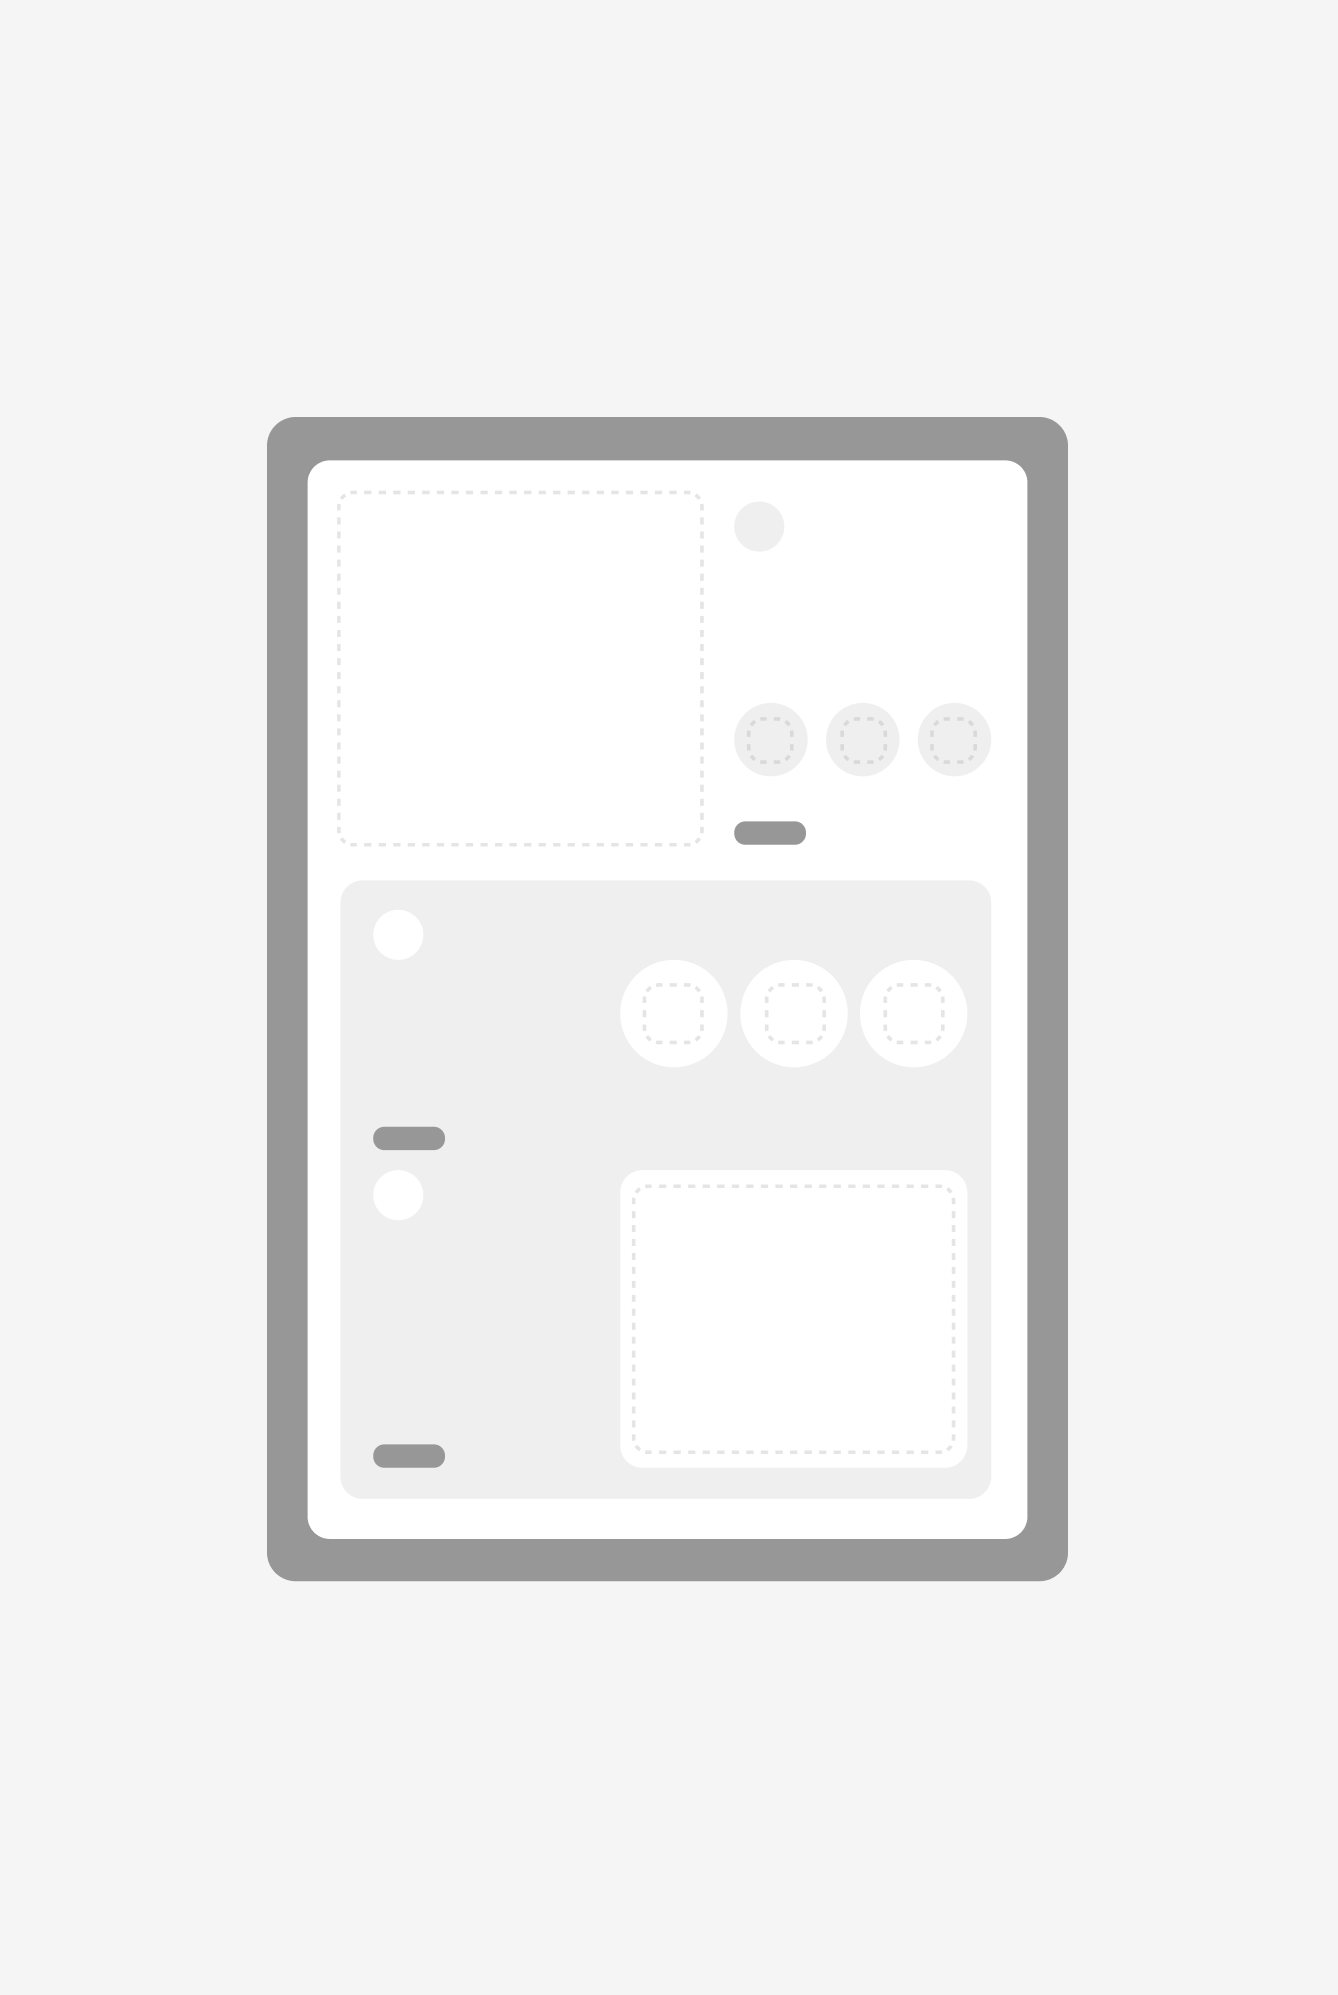
↳ [Test Result] When tabs were placed for navigation, they were often overlooked by users. Therefore, we organized all data on a single page to create a frictionless experience.
⎯ CHALLENGE 3
Balancing the presentation of data and insights
To address user feedback and the desire for more insights into the data presented, my team and I decided to create a video series showcasing our findings in a visual format. This allowed users to quickly get an overview of all dashboards and understand the data in a more impactful way.
↳ Screens from the findings video (1:38 min) published in November 2021
REFLECTIONS + IMPACT
Taking initiative in response to challenges
Taking initiative in response to challenges taught me the value of being proactive in addressing problems and finding solutions, which allowed me to become more perceptive, adaptive, and resourceful.
⎯ GLOBAL TRAFFIC
50K+ views
were generated internationally, driving significant traffic to the project.
⎯ MEDIA FEATURES
10 articles
mentioned the project, including Spacing, The Medium, and The Star.
TESTIMONIAL
Hear from my employer ⎯ "It's a pleasure to recommend Ecem with the highest possible praise..."

"Ecem worked with me since Spring 2021 and it is a pleasure to recommend her with the highest possible praise. Ecem’s work supported multiple research projects, including Taking Canada for a Ride and Toronto After the First Wave. She has a skill set that is unusual compared to her peers, which includes an ability to design and develop excellent-quality websites, infographics, videos, and animation.
Ecem worked diligently, professionally, and collaboratively. Her work ethic, attention to detail, and ability to interact effectively with team members, contributed to the success of all the projects she worked on. Above all, Ecem is an exceptionally creative, talented designer who can move from an idea to excellence in design and implementation."
©2023

Looking for full time opportunities starting Winter 2023. Let's connect →